Grade Level
6-10
minutes
1- 2 hrs
subject
Mathematics
Activity Type:
Simulation, climate change, Statistics, Probability
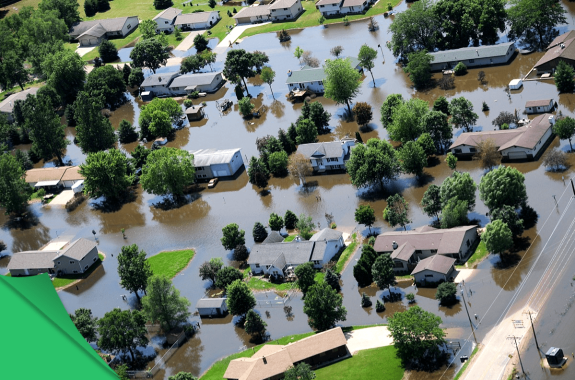
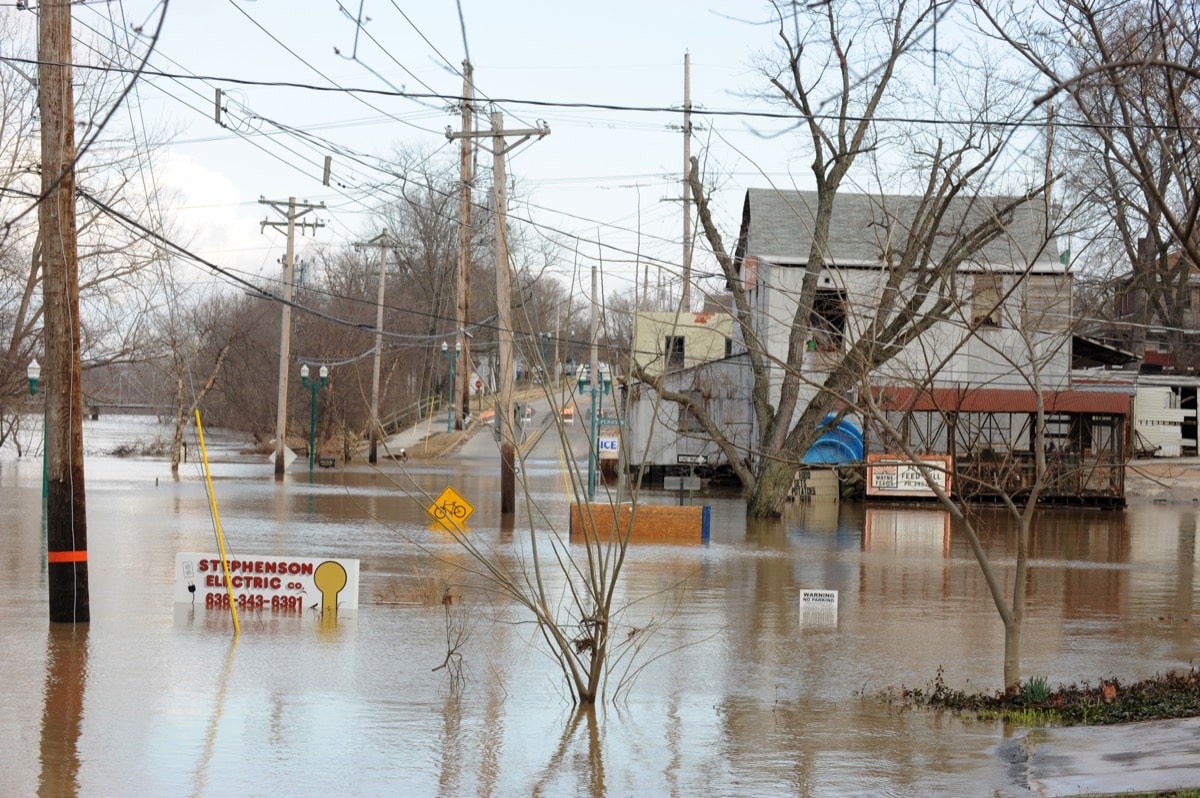
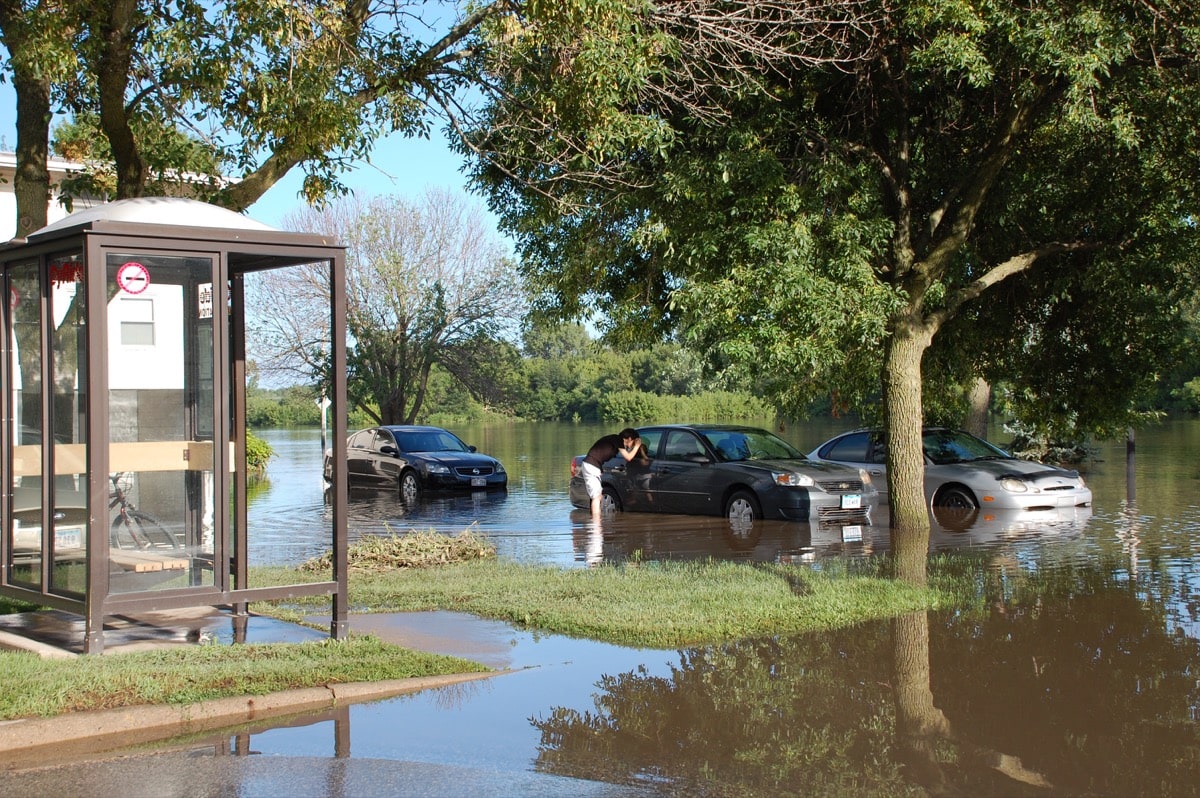
According to the United States Geological Survey, “more than 75% of declared Federal disasters are related to floods, and annual flood losses average almost $8 billion with over 90 fatalities per year.” Flooding poses serious risk, and as the climate changes, the number of homes in the United States facing a risk of flooding is increasing.
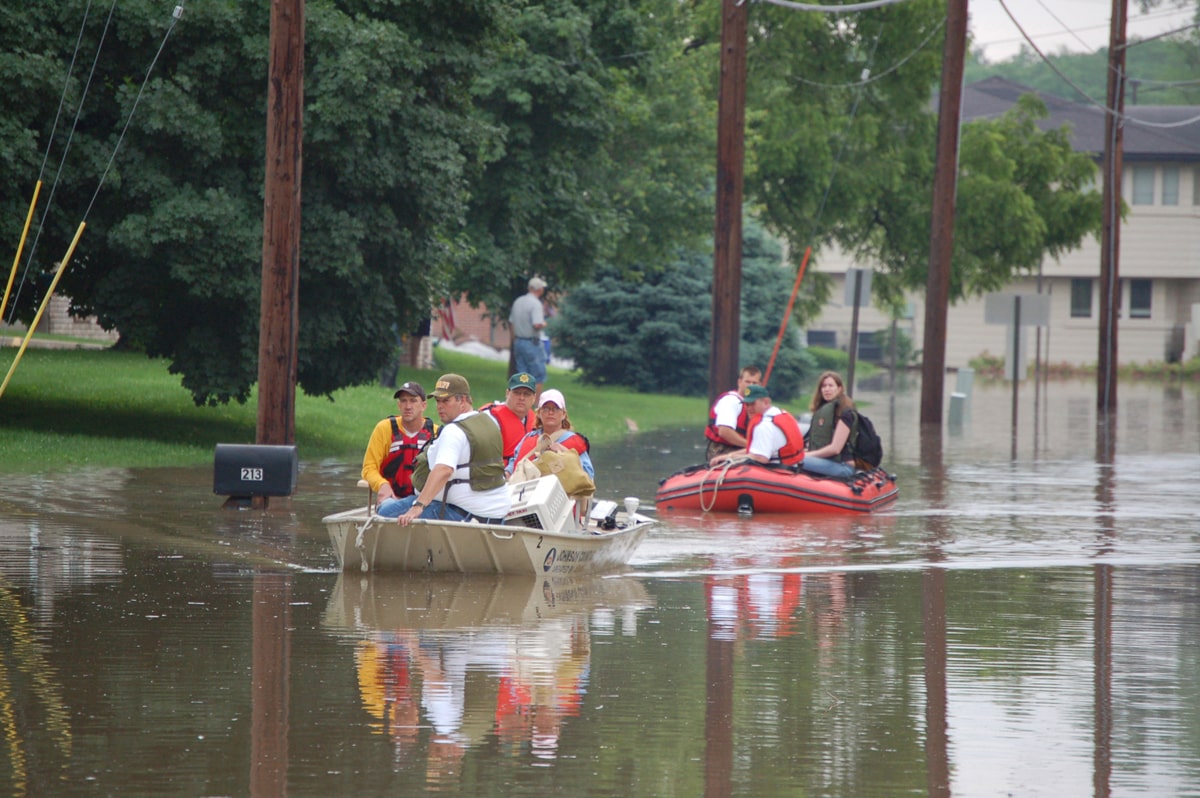
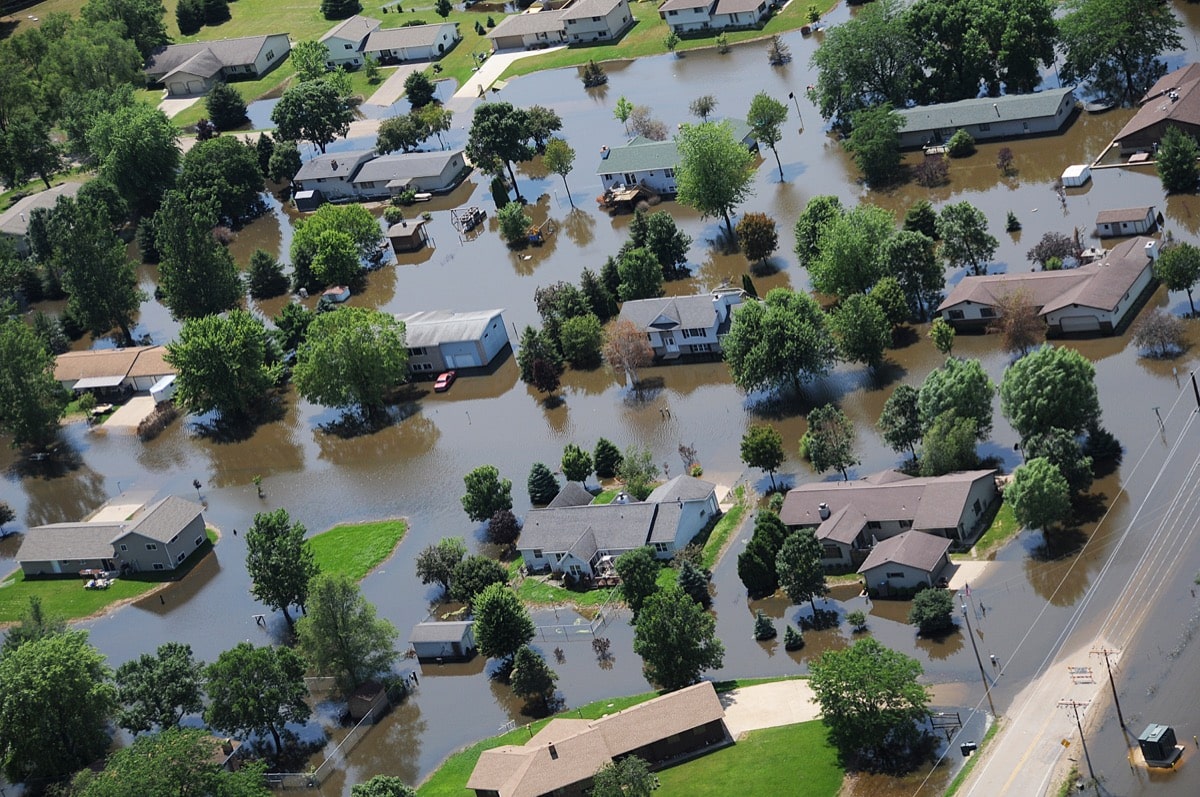
No one wants their home flooded—and certainly not more than once! However, multiple floods can uproot entire neighborhoods.
In this resource, you’ll learn why the term “100-year flood”–which is used to describe floods that have a 1 in 100 probability of occurring each year–may cause misunderstandings about the frequency of such floods.
How Frequent Floods May Uproot Whole Neighborhoods
Random Events: Experimental And Theoretical Probability
Floods are a frequent occurrence around the globe, causing loss of life, livelihood, and property. Historical data can tell us how flood-prone a location has been in the past. This is called the experimental (or observed) probability of a flood.
More generally, the experimental probability of an event is a number, expressed as a fraction, ratio, decimal, or percent between 0 and 1, which describes the recorded likelihood of a particular event. For example, if six floods occurred over 110 years at a particular location, the experimental probability of a flood at this location is 6/110, 0.054, or 5.4%.
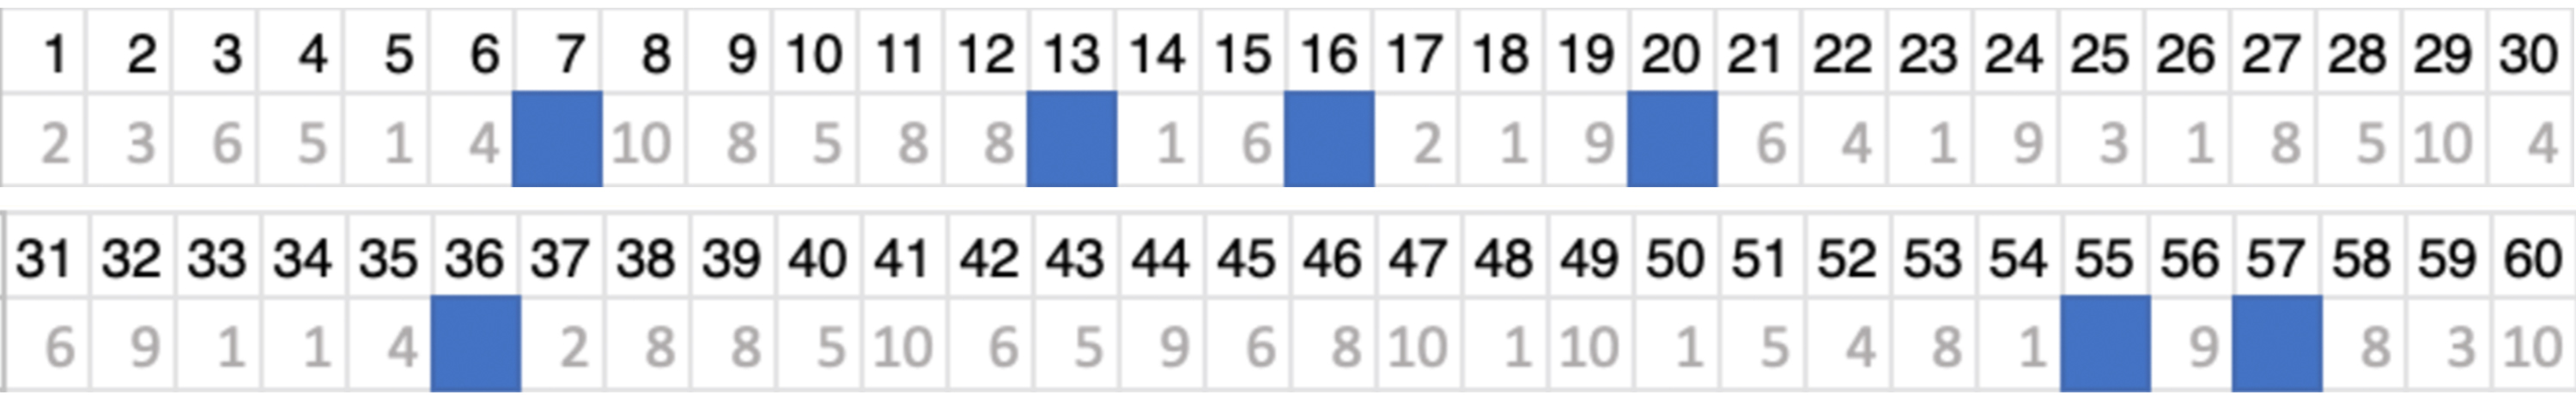
Similarly, the table below shows a sequence rolls of a 10-sided die. In the 110 rolls shown, the experimental probability of rolling a 7 is 19/110 = .173 = 17.3%
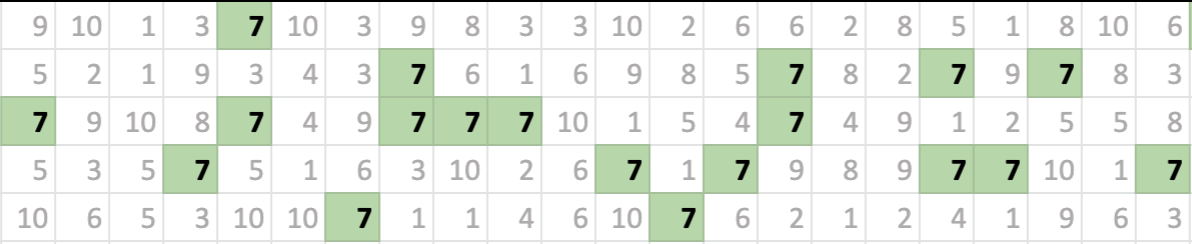
Some events, like rolls of a die, also have a theoretical probability. Theoretical probability (also a number between 0 and 1) describes the anticipated likelihood of an event. For example, knowing that rolling a 10-sided die has 10 equally likely outcomes, there is a 1 in 10, or 1/10 = 0.1 = 10% theoretical probability of rolling a 7 (or any other particular number) on any roll.
Note that in the table above, the occurrences of the number 7 do not appear to occur in a regular pattern. Despite the fact that we know the chances of rolling a 7, there is no way of predicting when those 7’s will appear. When the timing or sequence of an event is unpredictable, it is called a random event. Like the outcome of a roll of a die, the timing of a flood is random. You know what can happen (e.g., “flood” or “no flood”) but not when.
If you cannot know when a flood will occur, can you at least predict the number of floods over a specific time period? Alas, no, just as you could not have predicted that there would be exactly 15 rolls of a 7 in the table above.
If floods are unpredictable, how can communities decide whether to build or retreat in the face of potential flooding? There is at least one way: conducting experiments based on theoretical probability and analyzing the experimental probabilities that result.
In the activities that follow, you will use a roll of a 10-sided die to represent the yearly chance of a flood and use the results of experiments to explain what that 1 in 10 chance of a flood means in the real world.
Activity 1: What Are The Chances Of A Flood?
In this probability experiment, you will represent the chance of a flood by applying random numbers using a random number generator (like this one, or this one or this spreadsheet) that provides an equal chance of generating whole numbers from 1 to 10. (The instructions that follow will refer to a 10-sided die.)
Step 1
If a neighborhood has a 1 in 10 chance of a flood each year, what does the future hold? Think to yourself, and consider some facts about flooding if it’s helpful.
Step 2
You will conduct an experiment using a roll of a 10-sided die, where each roll represents the passing of a year in an imaginary neighborhood. A roll of a 7 will represent the occurrence of a flood. The theoretical probability of a roll of a 7 is 1 in 10 for a 10-sided die. Consider the following question:
Question 1
If you were to roll a 10-sided die 30 times, how many 7’s (floods) would you expect to see in the 30 “years”? Hint: If you think you will see exactly three floods (3 is 10% of 30), remember that the roll of the die is random; rolling three 7’s or “floods” is only one of many possible outcomes.
Step 3
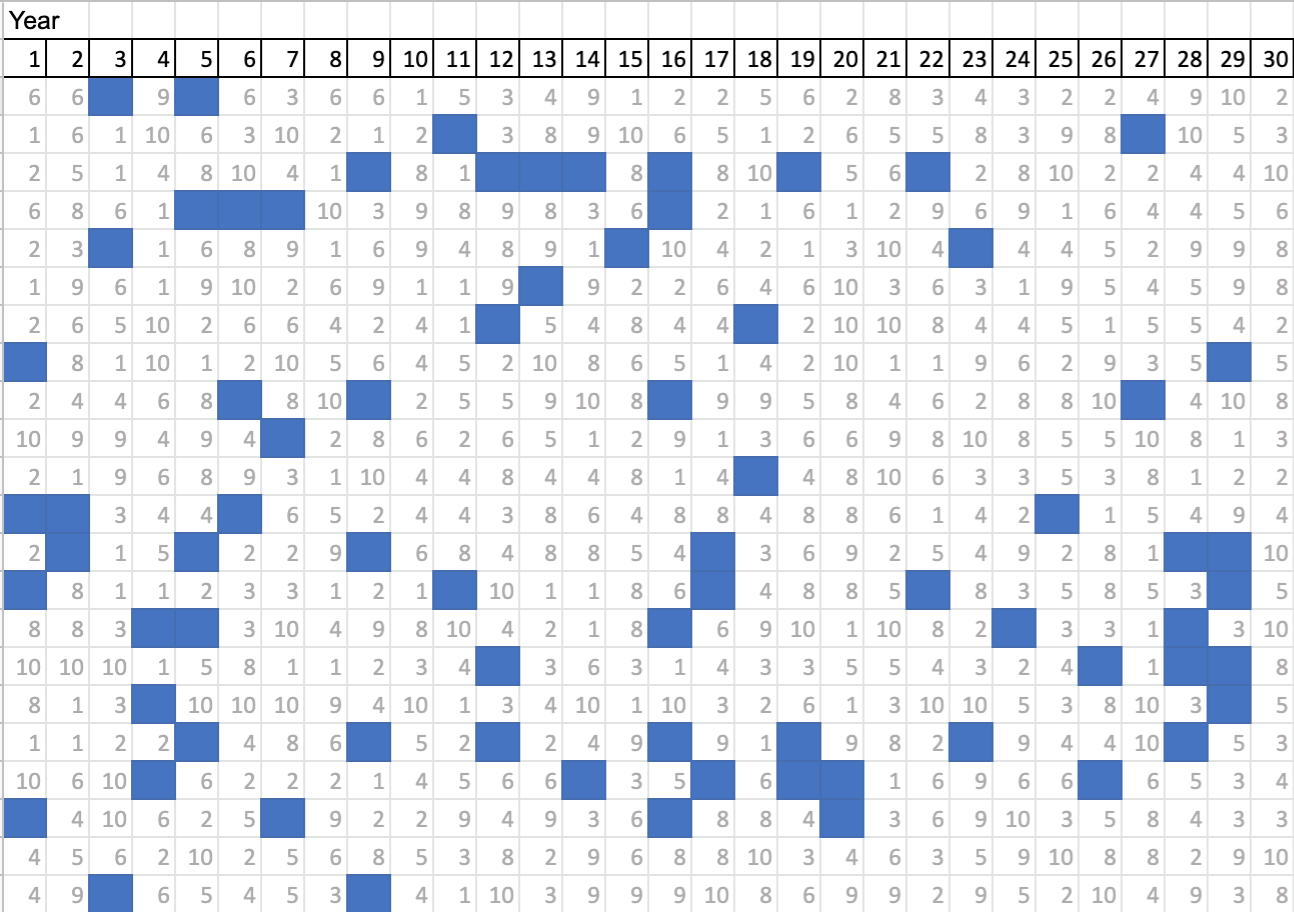
Roll the die 30 times and record your results on the handout, noting each roll of the number 7 as a year with a flood, as shown below. (You may also wish to use a spreadsheet, this GoogleSheets version, or this random number generator.)

Step 4
Collect and record data for a total of 100 “years” on the handout. Do not share your results with anyone yet.
You have just generated one of the many possible sequences of future occurrence of floods in the neighborhood. Record your thoughts about the following questions on the handout:
Question 2
What do you notice about your own results for 30 and 100 years? What do you wonder?
Question 3
What do you wonder about the results of the other students in your class? (For example, “I’m wondering if any of the students in our class had no floods in 30 years.”)
The number of floods in 30 years among the other students in the class will likely range between 0 and 8 (higher numbers are possible, but unlikely.) Is this reflected in the class data?
Activity 2: How Many Floods Might Occur In 30 Years? Walk Into The Future.
To understand what your results mean for the risk of a flood over a 30 year time period, you will pool your data together with other students in your class—by going for a “walk”. This is a whole group activity (best with at least 15 students). See instructions below for tips and suggestions for each step of the activity.
You will experience the class results visually, through your own collective motion. Choose a hallway or other large space (like a gymnasium or blacktop) to gather as a class and stand in a line. Your teacher can be the leader, or you can select a leader yourself.
Step 1
Each participant should bring their completed handout from Activity 1 to the location of the walk.
Step 2
Stand in a line, shoulder to shoulder, facing the same direction. On the left end of the line, mark a line with chalk or tape at 2 foot intervals. Choose a leader who will stand in view of the entire line—this leader will call out the years of flood simulation for all members of the class to hear. The leader should remind students that each step backward should be 2 feet in length.
Step 3
Look at your random number in column 1 on the handout. When the leader says, “1” take a step backward if you DID have a flood. If you DID NOT have a flood, stay still.
Step 4
When the leader says “2”, repeat: Take a step backward if you DID have a flood. If you DID NOT have a flood, stay still.
Step 5
Now you’ll continue for 30 “years.” When the leader calls out each year, take a step back, or stay still, as indicated by your data from the flood simulation. As you proceed, look around and observe what’s happening with the group as the “years” pass.
Step 6
After “30 years” have passed, take a look around you. Can you tell how many of your classmates had zero floods? One flood? Two? Three? More?
Step 7
Next you’ll make it even easier to see the data of the entire class. As a group, when the leader says “turn,” turn in place 90 degrees to the left. (You will see the backs of your classmates.) When the leader says “go,” walk towards the marked line, forming a single file lines, each corresponding to the number of floods you experienced.
Step 8
Look around at the “human bar graph” that you have created. In this bar graph, you can see the variety of different possible futures for the neighborhood. What do you notice? How many floods did most of your classmates experience in 30 years? How many students had zero floods in their sequence of 30 “years”? One? Two?
Step 9
Have the leader record the number of students who had each number of floods in 30 years for use back in the classroom using the chart below.

Activity 3: Examining Distributions Of Data: Possible Futures
You will examine what experimental results say about the future of flooding in the neighborhood.
As you have seen, each run of the experiment “roll a 10-sided die 30 times” produces a random sequence. The actual future of a neighborhood with a 10% chance of a flood each year might be represented by one of the sequences you generated. Which one will it be? Again, it is not possible to know with certainty. However, the results of your whole-class experiment do reveal which possible futures are most likely.
Step 1
Count the number of 7’s in the next two sets of 30 rolls that you collected earlier.
Step 2
Add these results from the first set of 30 rolls to the class results from the “walk.” This tally of results is called a distribution: a display of how often each possible outcome occurred in a data set.
Step 3
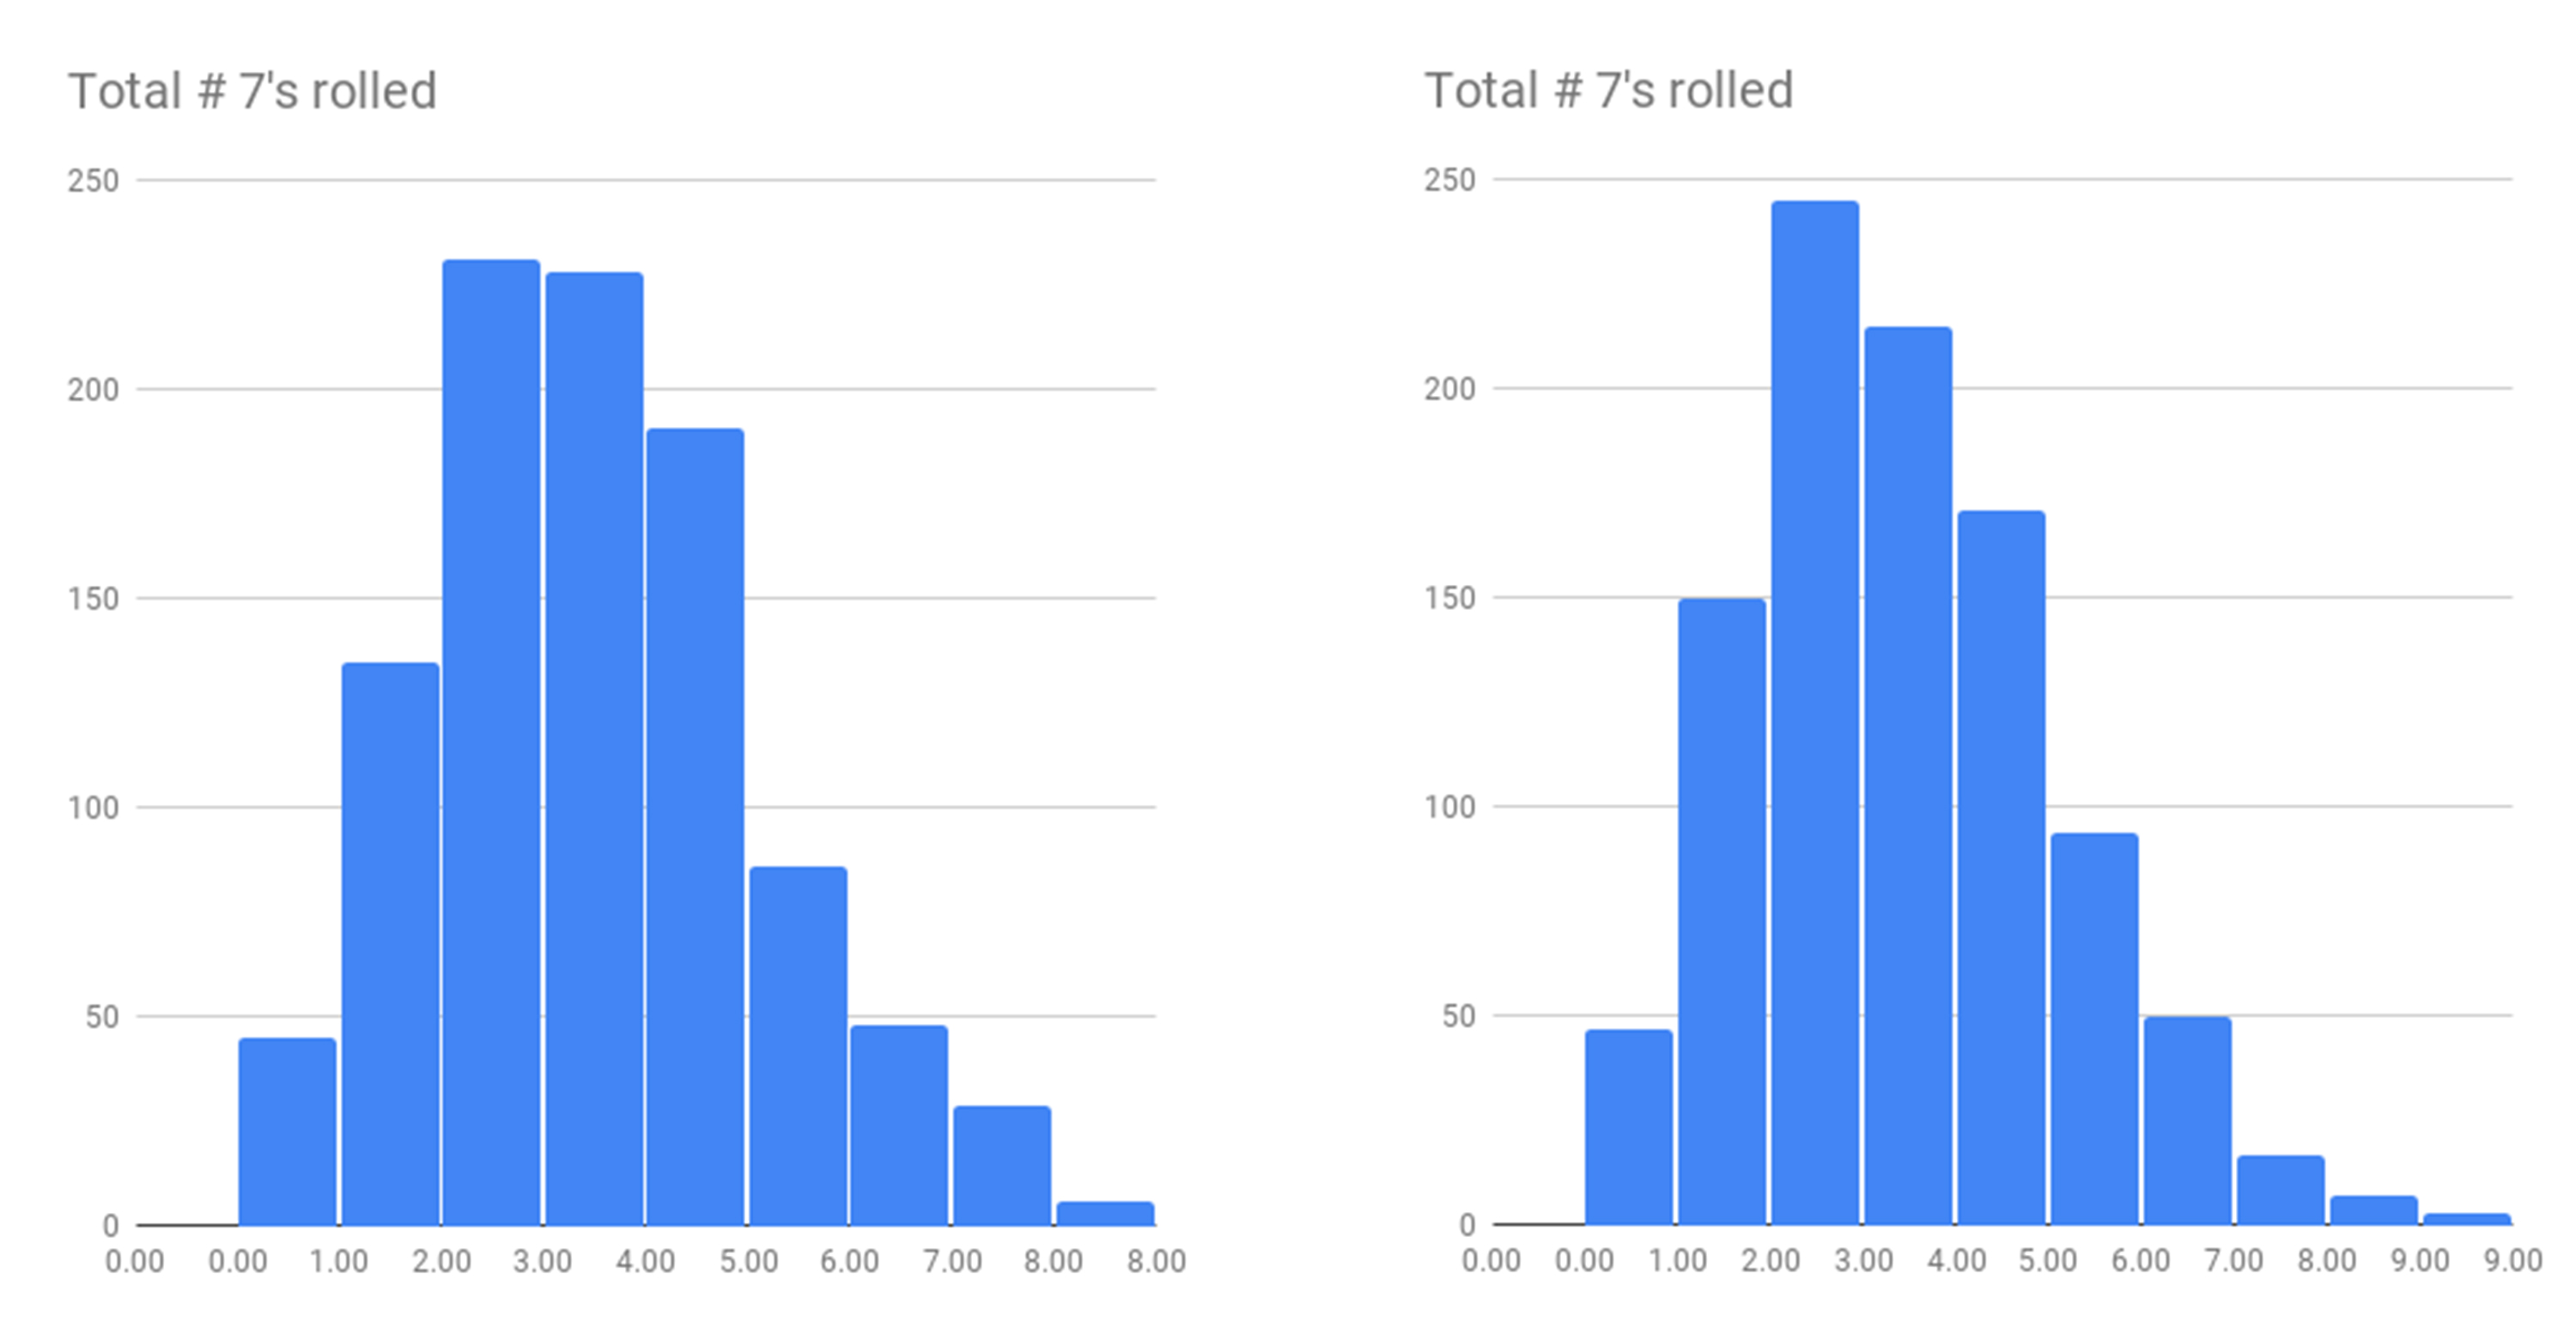
Look at the handout where you will find a distribution of outcomes from an experiment that included 50 sets of 30 rolls, and another with 1,000 sets of 30 rolls. Consider the following questions, individually or in a small group:
Question 4
What was your class’ experimental probability of experiencing exactly 3 floods? Of 4 or more?
Question 5
After examining the class distribution, and the distributions provided, how might you refine your previous answer to Q1: “How many times would you expect a flood over the course of 30 years?”
Question 6
What else do you notice or wonder about the class results, as displayed in the bar graph?
Step 4
Discuss your observations and wonderings with other students. You’ll probably notice that the distributions illustrate that two or three floods in 30 years are the likeliest possibilities. Is it surprising that four or more floors occur in at least ⅓ of the experiments?! Why?
You can use this spreadsheet to repeatedly generate 1,000 sets of 30 rolls of a 10-sided die. Each one will be different, but you will find them remarkably consistent in what they reveal about possible futures. (See the supplementary materials for printable examples of the distribution of the number of 7’s in 1,000 sets of 30 rolls of a 10-sided die.)
Activity 4: Explaining The Risk Of A Flood To The Public
In these activities, you have examined the probabilities of what would be called, using current terminology, “10-year floods.” See why the U.S. Geological Survey is moving away from such language and the misconceptions about the chances and timing of floods that occur in the news.
Imagine you are a writer for the news media or a public organization. You would like to write an article to educate the public about the chances of experiencing a “10-year flood”. Write a draft of this article, making sure to address the following questions:
— How can experimental probability help us anticipate (but not predict) the future chances of a flood when a neighborhood has a 1 in 10 chance of a flood each year?
— How can looking at a distribution of data based on an experiment help us understand what to expect in the future?
— How many floods should a neighborhood with a 1 in 10 chance of a flood each year expect to see in the course of 30 years? How certain can residents be that no more than the theoretical number of floods (exactly 3) will occur?
Extension: How Often Do 100-Year Floods Occur?
Major floods that have a 1 in 100 chance of occurring each year are commonly called “100-year floods” and are often mentioned in the news. The term “100-year flood” suggests to some that once a flood occurs, another won’t occur for another 100 years. You can test this idea out using experimental probability and distributions.
In the prior activities, you may have noticed some interesting things about the sequence of floods over the course of 10 years. For example, consider the sequence below where the probability of a flood occurring was 1 in 10. The floods do not occur 10 years apart. Instead, the second flood occurred 2 years after the first. The third flood occurred 9 years after the second, the fourth flood, 8 years later, and the fifth, 1 year after that.

For this set of 60 years, floods occurred 6, 3, 4, 16, 19, and 2 years after the previous flood.
The length of time between floods is called the recurrence interval. Drawing from your previously collected data, as a class, you can make a distribution of these times and see what it reveals.
Procedure
Step 1
Get a set of sticky notes and your handout from the earlier distribution activity.
Step 2
Examine the sequences of 100 random numbers you recorded on the handout, and record on paper the number of years between each flood. (For example, 6, 3, 4, 16, 19, and 2 would be the numbers to record in the 60-year list above.)
Step 3
Using one sticky note for each interval, write the length of each interval on one sticky note.
Step 4
Organize your sticky notes from least to greatest numerical value.
Step 5
As a class, two or three at a time, place your notes on a wall or board to create a bar graph of the recurrence intervals.
Question 1
What do you notice in the class distribution of recurrence intervals? What do you wonder?
Question 2
Below you will see a distribution of the recurrence intervals between “rolls of a 7” constructed from 500 people who rolled a 10-sided die 100 times. Again thinking of rolls of a 7 as “a year with a flood,” you can see that one year between floods is the most likely outcome! Does this surprise you? Why?
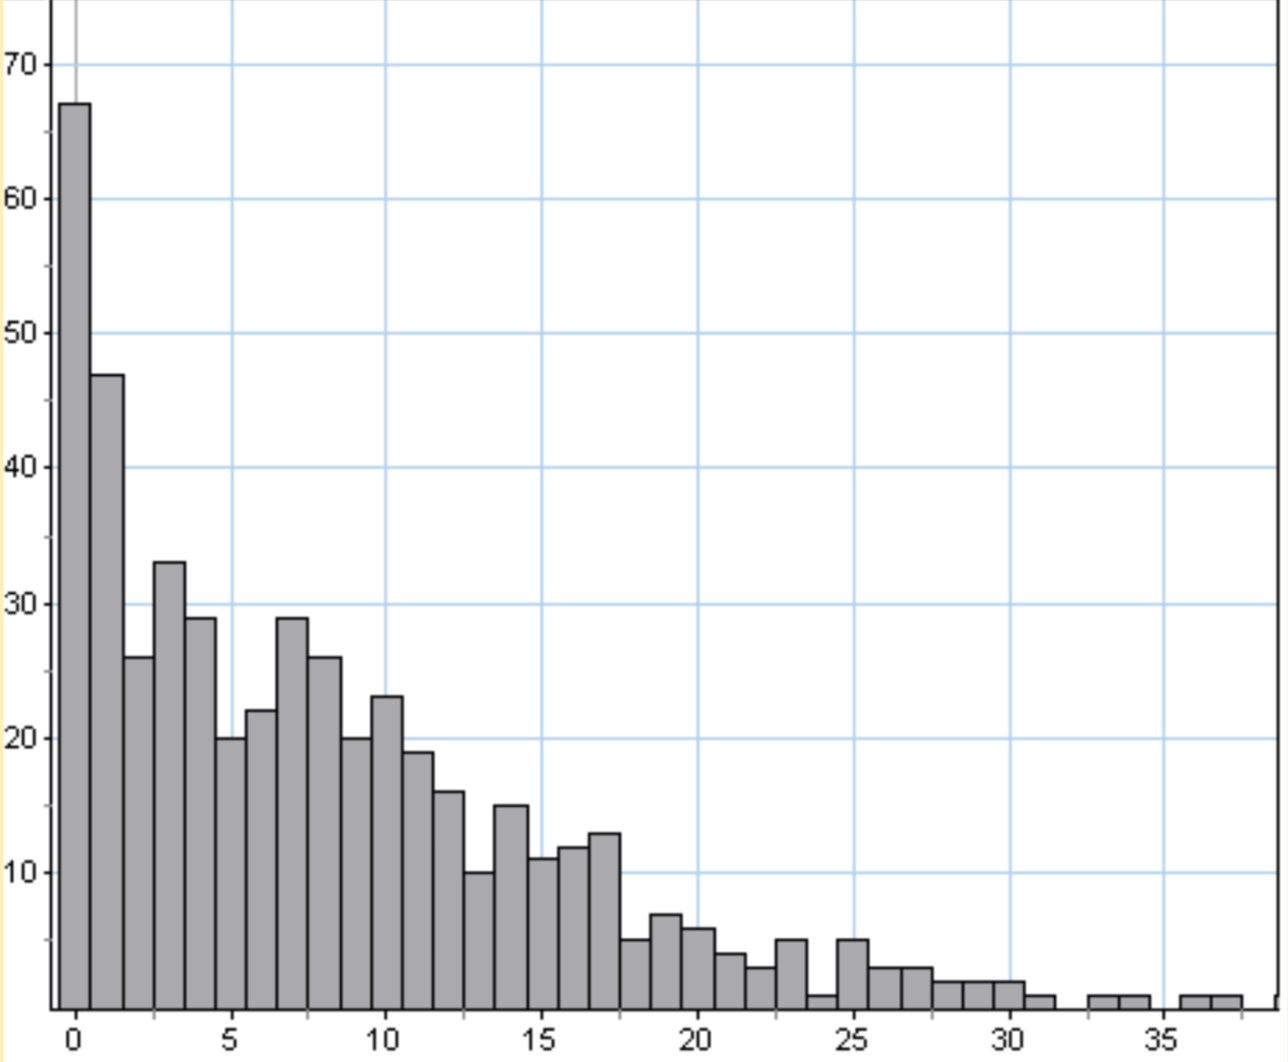

Question 3
In this example, there is a 67/500, or 12.3%, experimental probability of a floor occurring one year after the previous one. What is the class’ experimental probability of this outcome?
Question 4
Use the example to calculate the experimental probability that you will wait less than 10 years for our next flood. What is the class’ experimental probability of less than 10 years between floods?
Question 5
Return to your news article educating the public about their chances of experiencing a flood. Add to your article by addressing recurrence intervals. Note that some believe that after they experience a “10-year flood,” a flood will not occur again for another 10 years. What does the distribution of recurrence intervals tell us about this belief?
Common Core Standards
CCSS.MATH.CONTENT.HSS.MD.A.3
Develop a probability distribution for a random variable defined for a sample space in which theoretical probabilities can be calculated; find the expected value. For example, find the theoretical probability distribution for the number of correct answers obtained by guessing on all five questions of a multiple-choice test where each question has four choices, and find the expected grade under various grading schemes.
CCSS.MATH.CONTENT.HSS.MD.A.4
Develop a probability distribution for a random variable defined for a sample space in which probabilities are assigned empirically; find the expected value. For example, find a current data distribution on the number of TV sets per household in the United States, and calculate the expected number of sets per household. How many TV sets would you expect to find in 100 randomly selected households?
CCSS.MATH.CONTENT.HSS.MD.B.6
Use probabilities to make fair decisions (e.g., drawing by lots, using a random number generator).
CCSS.MATH.CONTENT.HSS.MD.B.7
Analyze decisions and strategies using probability concepts (e.g., product testing, medical testing, pulling a hockey goalie at the end of a game).
Credits
Written by Ralph Pantozzi
Probability simulations and figures by Ralph Pantozzi
Edited by Shirley Campbell, Ariel Zych, and Daniel Peterschmidt
Digital production by Daniel Peterschmidt and Ariel Zych
Educator's Toolbox
Meet the Writer
About Ralph Pantozzi
Ralph Pantozzi is a teacher and department chair at the Kent Place School in Summit, New Jersey. In his classrooms, students talk, investigate phenomena using physical objects and technological tools, pose questions, and choose their own mathematical adventures. When he’s not researching his own family’s genealogy, Ralph will be found reading about current and historical events, or visiting historical landmarks with his wife and two children.