Revealing Envy, Laughter, and Curiosity Through Data
16:59 minutes
In this era of big data, bits of personal information are leaking out every time we take a step, read a website, or “like” a Facebook post. Companies collect and analyze these data to reveal our patterns of behavior. But can we use data to gain insight into our thoughts and feelings? Can we really get to know someone from their data?
Giorgia Lupi and Stefanie Posavac, visual designers and authors of the new book Dear Data, tested this idea. Each week for an entire year, they drew and swapped everyday data on their personal experiences, from animals they encountered to the number of times they felt jealous. They discuss what tidbits of mundane data can tell us about ourselves.
We’ve included an excerpt from the book below, in which the authors represent phone addiction, loneliness, and laughter through their hand-drawn data postcards.
Giorgia Lupi is an information designer and co-author of Dear Data (Princeton Architectural Press, 2016) in Brooklyn, New York.
Stefanie Posavec is a designer, artist, and co-author of Dear Data (Princeton Architectural Press, 2016) in London, England.
IRA FLATOW: This is Science Friday. I’m Ira Flatow.
When you were growing up, did you have a pen pal? Maybe someone you met during a summer at camp and keep in touch by sending each other postcards? Get to know more about one another through small bite-size snapshots? Well, my next two guests are two visual designers who met at, well, sort of an adult version of summer camp– a professional conference.
They lived on different continents, and they wanted to get to know each other better so they sent each other postcards for a year. And being visual designers, they didn’t just send written stories. They swapped pictures, visualizing their thoughts.
In their professional lives, they work with big data, lots of information. So they wanted to know, what does any of this data really tell us? You could pick out patterns but what can this information reveal about our thoughts and feelings? Can you get to know someone through data?
Well, their new book, Dear Data, is a collection of that correspondence. Giorgia Lupi is an information designer based out of Brooklyn and New York. Welcome to Science Friday.
GIORGIA LUPI: Thank you.
IRA FLATOW: Stefanie Posavec is a designer and artist based out of London.
STEFANIE POSAVEC: Hi.
IRA FLATOW: Welcome to Science Friday.
STEFANIE POSAVEC: Thank you.
IRA FLATOW: Thanks for coming across the pond.
STEFANIE POSAVEC: Oh, yeah. No problem.
IRA FLATOW: And they’re the authors of the new book, Dear Data. I’ve got to say that both of you are real geeks. I mean, real data geeks. Would you say that?
STEFANIE POSAVEC: I think we’re OK with that. We own that.
[LAUGHTER]
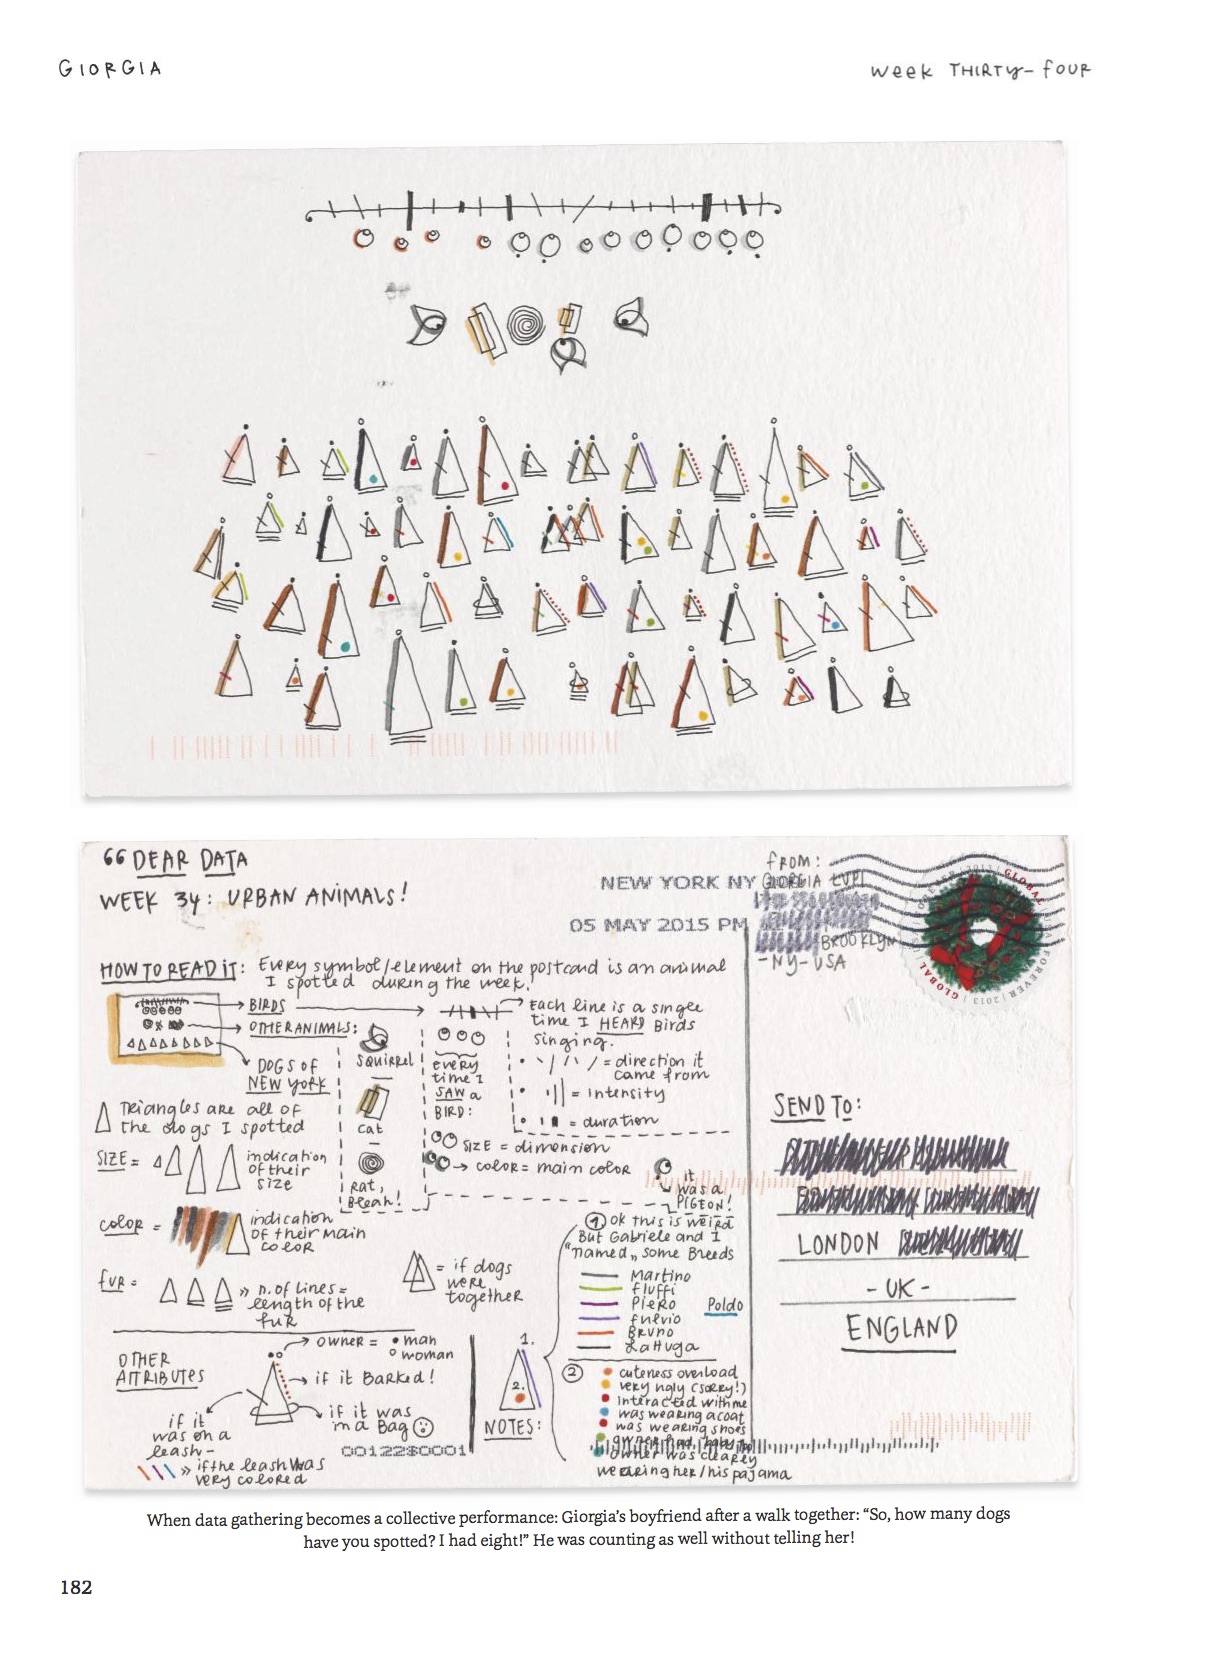
IRA FLATOW: You should be proud of that. Right? Right. Giorgia, you created these postcards over 52 weeks, and the topics run from the more concrete, like the number of animals you saw, to the more abstract, like negative thoughts. How do you choose what topics?
GIORGIA LUPI: So in the very beginning, actually, as you said, we were challenged by the idea of getting to know each other through our data. And so we decided upon the 52 weeks topics to figure out how you can really cover multiple aspects of your days, your activities, thoughts that you have in your mind, but also your surroundings. So to tell the other person really the story not only of yourself, but also the story of your days.
IRA FLATOW: You both work with data every day on your job. With the Dear Data project, what did you want to do differently than what you do in your office?
STEFANIE POSAVEC: Well, I think the main thing that we wanted to do differently is that we’re actually different than a lot of people in our field because we don’t really code. But we prefer to work with data in a very handmade way, sketching data as part of our process. A lot of people use code to do this instead.
So we wanted to take this process that we do to make a polished, finished product on screen or in a magazine. And we want to bring that to the fore and really focus on a year of working by hand and drawing data in this very handcrafted way that we like.
IRA FLATOW: You have handcrafted beautiful, beautiful drawings in your postcards. But what can you accomplish by making data into drawings that you couldn’t do with word? What was the advantage here?
GIORGIA LUPI: Well, I think that by tracking a week of a specific topic and then having to visualize it, everything that is in that topic– like, for example, the number of thank you’s that you said and who you said these thank you’s to– when you visualize it, it really jumps at you. So when you see your data, you can see patterns. And also, I think that the reason why we chose this like medium of drawing with the data and having it very analog was also to try to challenge the personality that data might communicate and really trying to reconnect it to– reconnect the numbers to what they stand for, which are actually stories of our lives.
IRA FLATOW: Yeah, they are stories.
GIORGIA LUPI: Yeah.
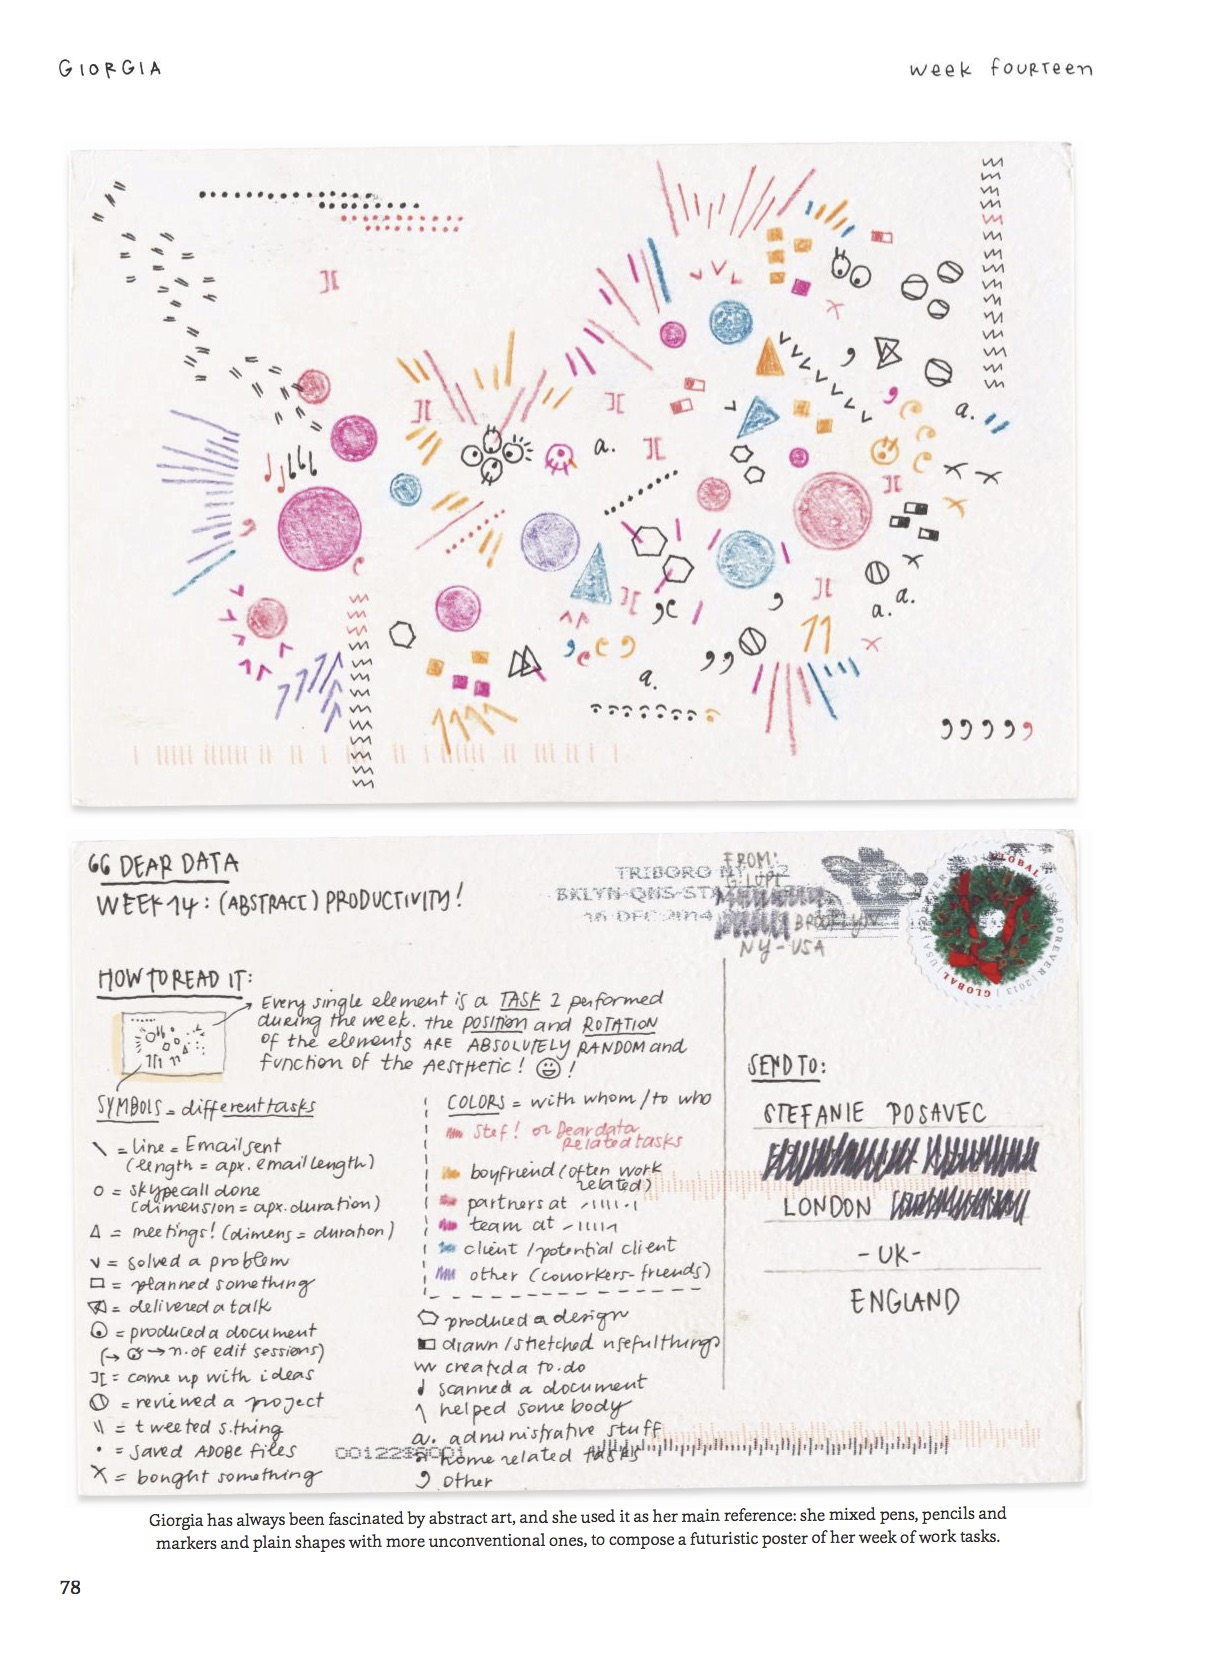
IRA FLATOW: And boy, you used up every micro space on those postcards to get everything in there. Let’s look at a few of the postcards. You both have very different styles to your postcards. Here’s one where, Stefanie, you charted your abstract productivity for the week. Describe what you did there.
STEFANIE POSAVEC: Oh, well that was actually– well, OK. Yeah. Yeah, OK. For that week, we sort of approached it from different ways. So I took that week to look at my schedule. So I just tracked every single minute of the day and what I was doing at the moment. And then I just wanted to enjoy drawing some very detailed, organic, plant-based ways of representing every single minute of the day that I was awake. And I know that, yeah, Giorgia approached it from a different way.
IRA FLATOW: Yeah. It’s a totally different photo. Drawing.
GIORGIA LUPI: Not only the drawing. We also approached– this is a very particular week– we also approached the topic in a different way. So that the shared theme was schedule. And of course, Stefanie tracked what she did. But I tracked what I needed to do, which is very telling of our personality. So I tracked my tasks and not really what I did.
IRA FLATOW: How did you decide how to make the diagram? Sometimes they’re circles. Sometimes they’re lines. Is that just something that the data better fit at the time. Or do you say, well, I did this yesterday, did this last week, let me try something else this week?
GIORGIA LUPI: So normally, what you would do after a week of collecting your data, we would spend some time really analyzing what is in there. And so finding a main story. Sometimes, a main story is like organizing your data chronologically because you really want to tell the story of the week. Some other times, you choose to categorize the data into groups. And that becomes the visual model that guides all of the visualization of your elements.
And actually, since this is a very experimental project, I also think a lot of time we would be more kind of like free form. And yeah. We will allow ourselves to experiment more than in a data visualization project.
STEFANIE POSAVEC: Yeah. And I think one thing that we really liked about it is that because we were drawing, we were kind of indicating to our chosen field of data visualization that we were experimenting and wanting– you know, it is a place for us to fail. Well, not really, but make mistakes and just embrace making mistakes and then get better in the process. So I think was another great reason to draw by hand, is just accept all of the imperfections and know that through these imperfections and messy lines and messy datapoints that we’re slowly getting some somewhere better than we were before.
IRA FLATOW: Is this sort of a rebellion, though, against the way you do big data in your office, with all the computers and the collection of all the numbers? And here you’re drawing things. They’re not exact. They’re not precise.
GIORGIA LUPI: Well, I think that normally we should just really stop thinking that data is perfect. Data is imperfect because it’s always collected by a human being. And what you decided to collect or omit really inform the data set. So I think we wanted to challenge that. But also the whole point– also when you work with big data is making it more understandable, more contextual, and even smaller. So I think there is value to working with small data and to find a way to represent small data in a contextual way.
IRA FLATOW: I’m sorry. You wanna say something?
STEFANIE POSAVEC: Oh. I mean, I think also through the project– because big data seems intimidating, you know? It seems like something that only scientists can– and people who know how to code, and people who have amazing software and technology can really access. And so I think, really, by bringing it down to this very domestic space and drawing it by hand, we’re showing people that it doesn’t need to be scary or intimidating. But really, you only need a pencil and paper to begin, to understand what people are doing in this kind of rarefied tower of technology.
IRA FLATOW: How do you prevent yourself from influencing the data? I mean, if you say, I’m going to collect data of how many glasses of water I have today. Now, if you want to have a glass of water, you could say, well, that’s going to affect my count. Should I have the glass or not have it. And even just thinking about it is going to affect the results.
GIORGIA LUPI: Yeah. Actually, of course, the act of observing a note is it effects your behavior. Then, I think, it’s also a matter of getting creative on how you actually track the data. Because if you want to have a glass of water, but then you don’t have it because you don’t want it to influence your data tracking, maybe you can write something like, I wanted to have a glass of water but I didn’t because–
So it can really be creative in how you include the omissions.
IRA FLATOW: How about your partners? Did they know you were collecting data on them? Was it important to keep it secret or did you tell them?
STEFANIE POSAVEC: Well, yeah. So we had this week where we were gathering data on our husband– husband or boyfriend, at the time, for Giorgia. Now husband. And so yeah, we didn’t want them to manipulate the data. So we thought, OK, we’re going to keep it secret.
And then we both went away and we did something very similar where we were gathering feelings of love or annoyance from our partners. And so, I know with my husband, he was like, oh, what are you gathering this week? And I’m like, oh, nothing, nothing.
But then at the end of the week, I said, OK, just to let you know, we’ve been gathering data about you two and can I use this data? Are you OK with it? He thought it was really weird but quite sweet at the same time. And finally, he said, yes, you can use it in your postcard. I don’t mind.
IRA FLATOW: Well, I’m looking at one of your data collections and it’s called, “I Data You.” A little heart drawing there. Page 158. And it says, “by counting all of her boyfriend’s positive actions, Giorgia realized how many there are and how little attention she usually pays to them.”
GIORGIA LUPI: That’s very true. I think everyone could relate. If you would only try, for one week, to try–
IRA FLATOW: It says, right here, “you should all try this at home for at least a week.”
GIORGIA LUPI: I think it’s truly telling because it’s so normal to just focus on the things that annoys you about your partner and not really to focus of all of the little acts of when he or she takes care about you, takes care of you. I think it’s super normal, in our life, to just focus on the things that annoys us more than the thing that makes us feel better.
We really, I think, both noticed how, by acknowledging and just paying attention to the little things that the person that you live with does to you, you also get even closer. It was a very, very special week for both of us.
IRA FLATOW: So it changed your lives by doing this exercise? By doing the book?
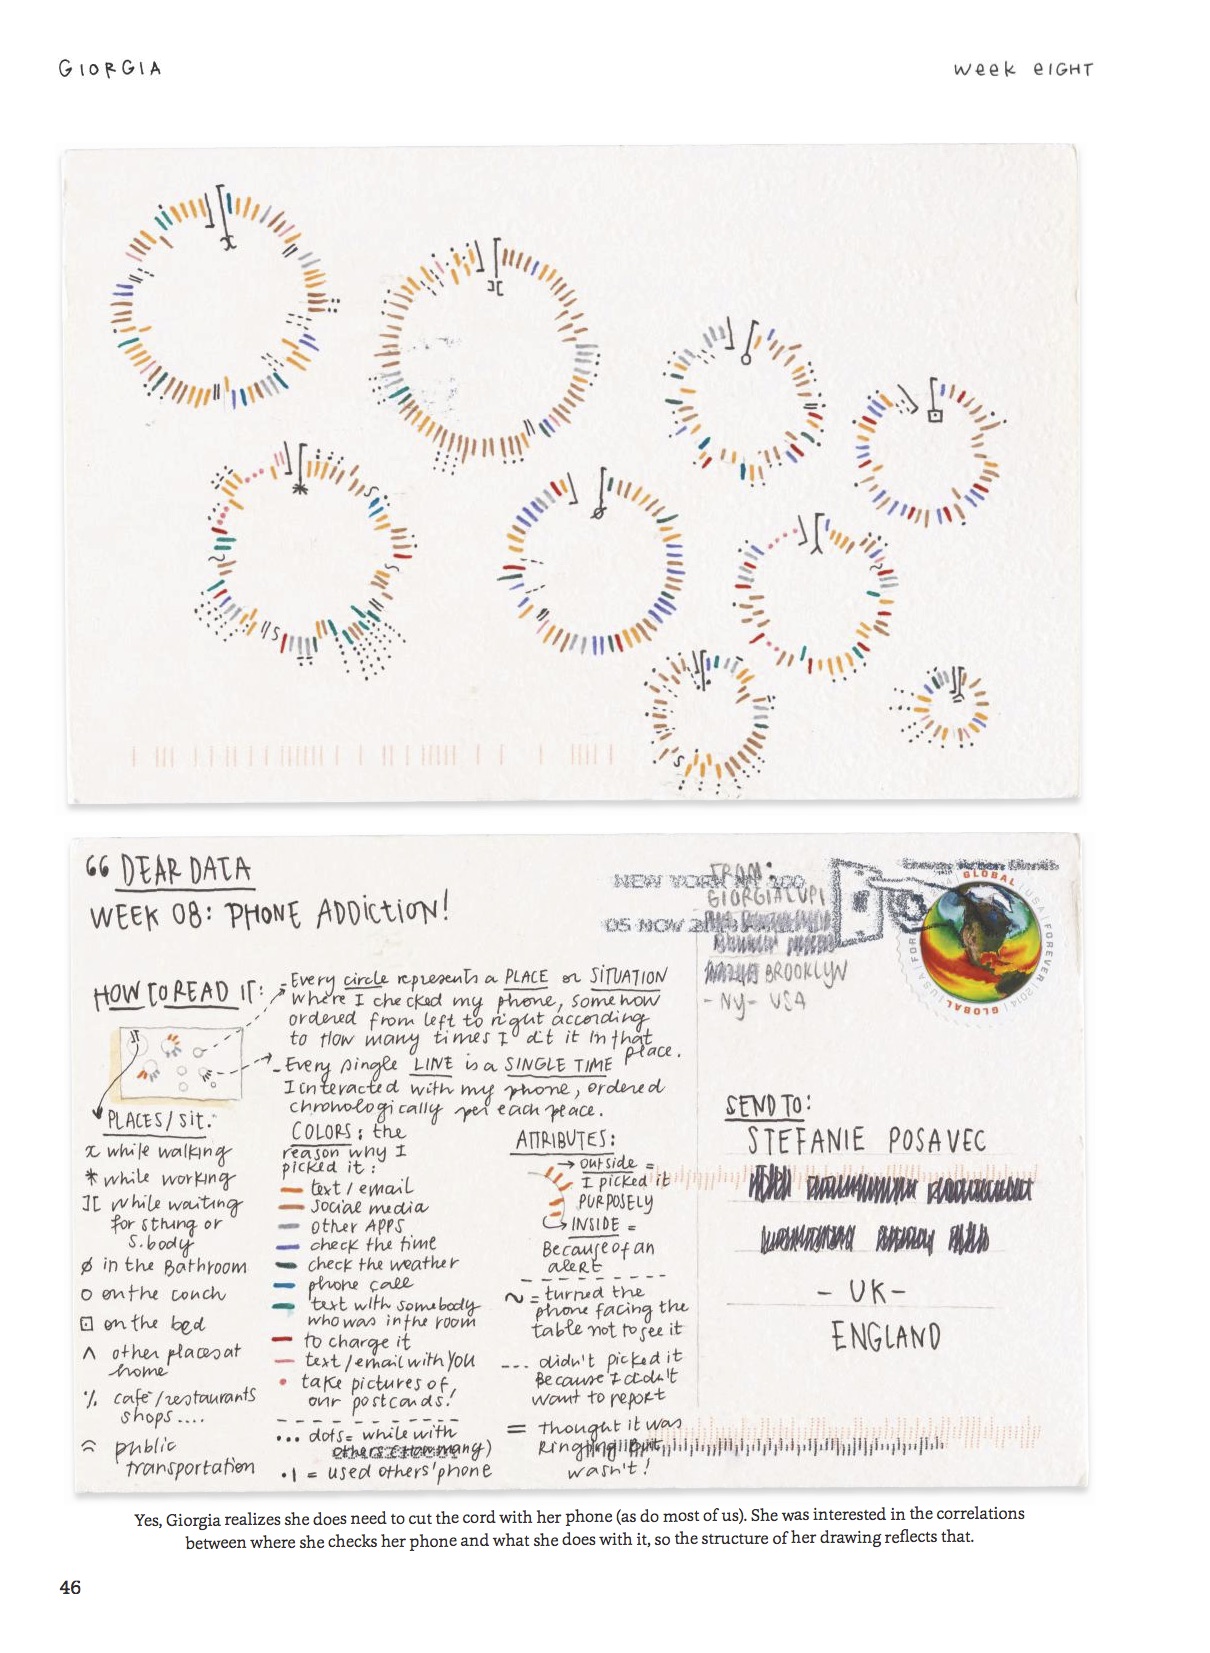
STEFANIE POSAVEC: Yeah. Yeah, Yeah. I think one of the ways that we can both agree that it really changed our lives is that it forced us to stop looking at our phones all the time.
IRA FLATOW: Was that something you measured at some point?
STEFANIE POSAVEC: Well, yeah, yeah.
IRA FLATOW: Do you have data on that?
STEFANIE POSAVEC: Yeah. Yeah. We definitely gathered data on our phone addiction and the types of apps we have on our phones. But it forced us to look at the world around us, and our emotions, and our interactions with people, and actually take a closer look at it and notice it in a way that we might not– I mean, we might not even look up and see what we saw around us without this really great exercise to force us to stop to gather the data and look around us.
IRA FLATOW: How did making charts of your actions change your behavior? You have to keep good notes, good charts.
GIORGIA LUPI: I think that we can call this project as a quantified journal, in a way. Because over a year, it was really a journal, a memoir, of our year in the form of data and then drawing. And now, also the fact that after a week of tracking, you will spend time analyzing your data because you needed to chart it. It really was a way of spending time with yourself and you would recognize areas of your behavior that you might want to improve.
And I think it’s hard to change in a week– tackling a weekly topic is sort of like a short span– but for sure, there were some weeks where we found that, oh, that’s really something that I want to discover more about me. So it was really an entry point to getting the right question to answer yourself when you want to improve your behavior.
IRA FLATOW: Talking with Giorgia Lupi and Stefanie Posavec, authors of Dear Data, on Science Friday from PRI, Public Radio International. I’m opening to a page here where I’m looking at one of the postcards that you wrote and you say, Stefanie, “worst legend ever. Sorry it took so long to draw and to redo.”
And it’s the one about clothing. What you’re going to wear. The week you both put in what you were wearing that week. And what’s remarkable, also, is that your graphs are almost identical. I mean, you were separated, so far apart, but you had the same data collection.
STEFANIE POSAVEC: Yeah. So there were these like nice, serendipitous moments where we both start from the same topic but we each have– our personalities manifested through what matters to us. What we choose to count and what we choose not to count. And so you can really tell a lot about us just through the data we gather, but also through how we choose to draw it.
And so it was really nice when we would go away and then gather very similar data. And then also present it– we wouldn’t even know that we had done the same thing until we had received the other person’s postcard maybe two weeks later.
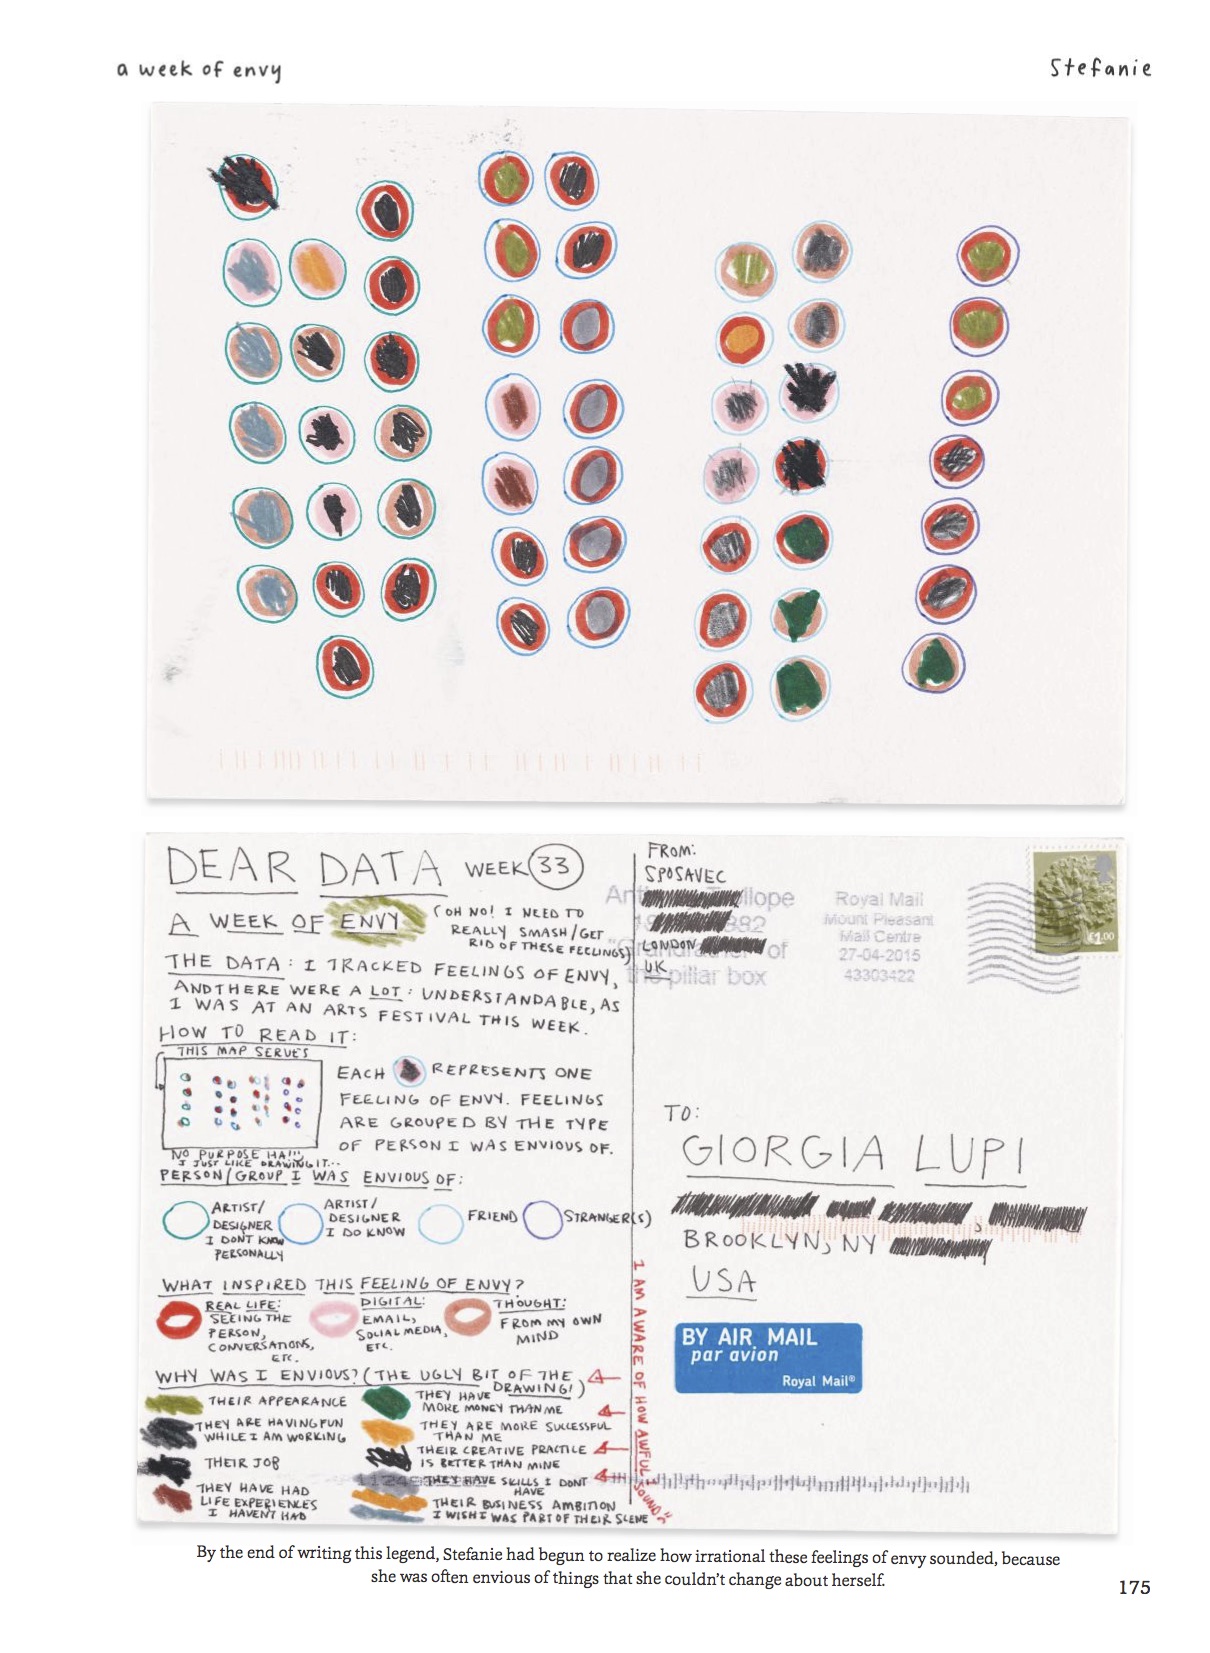
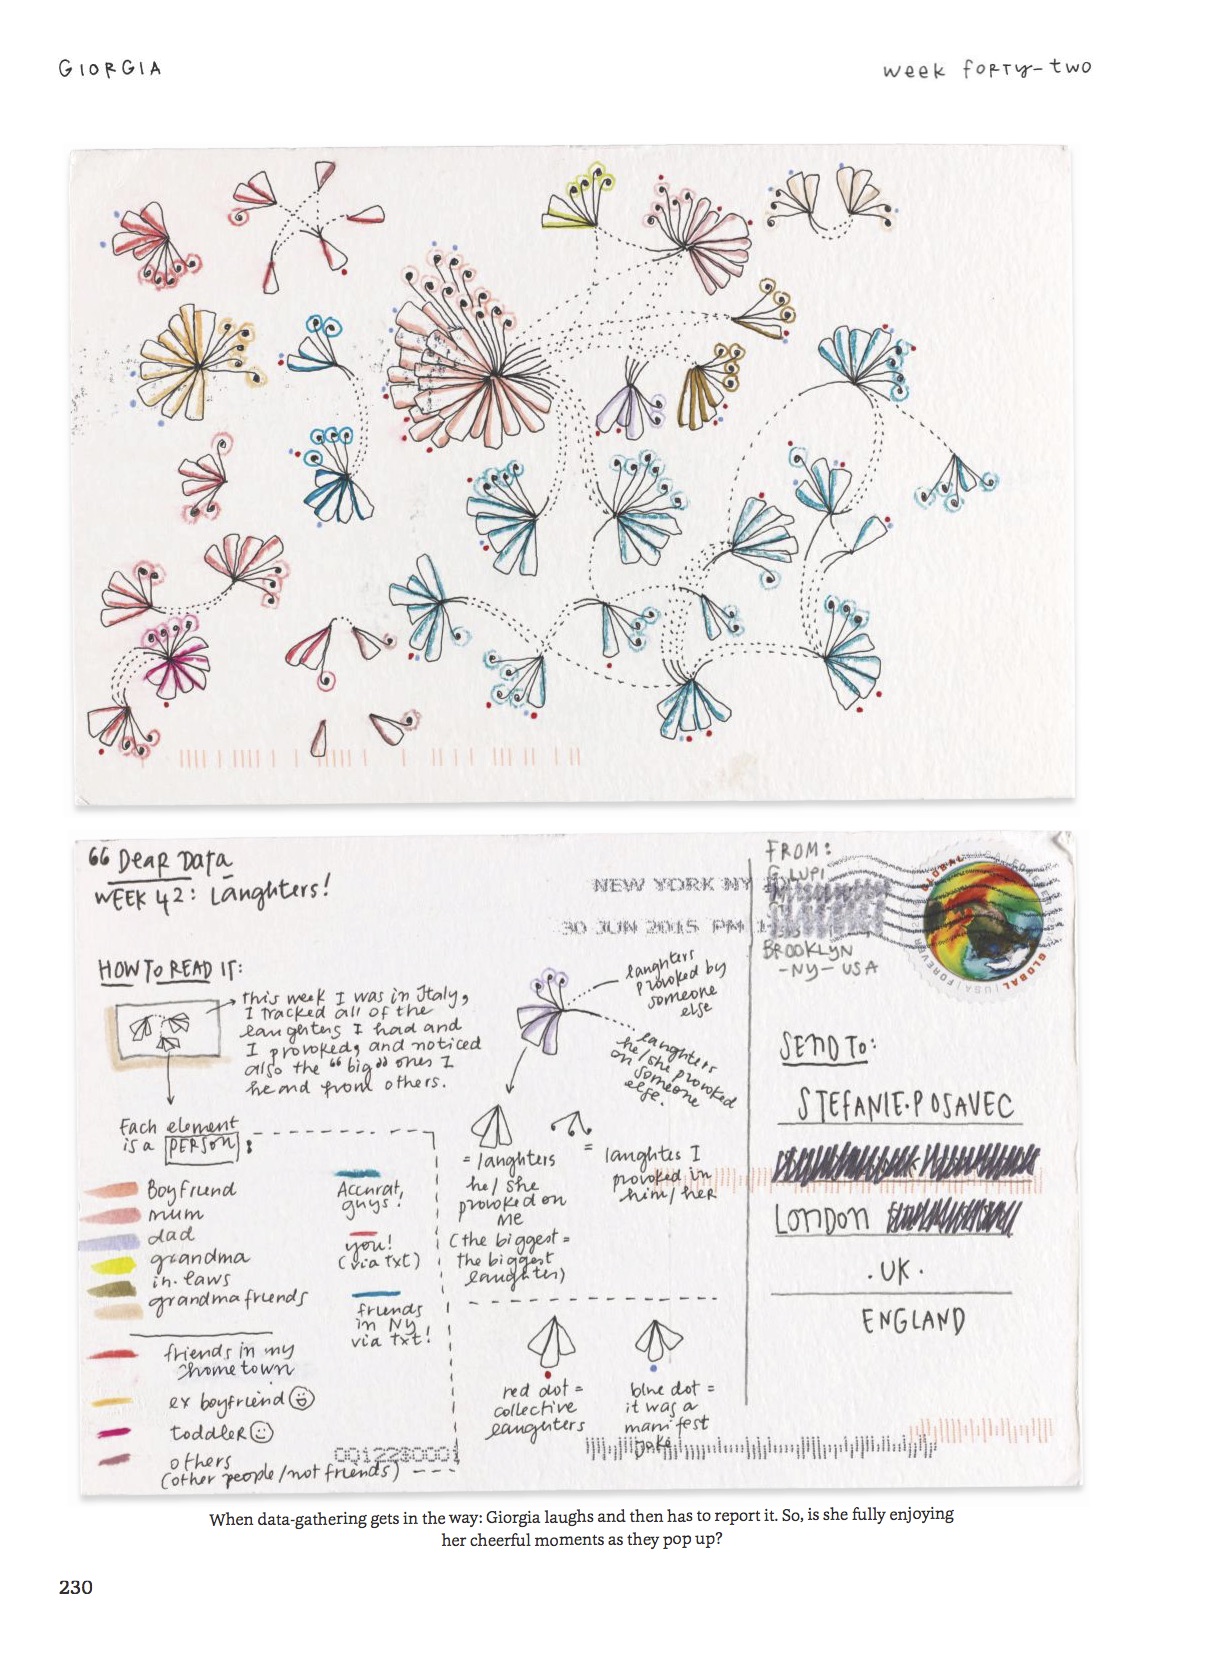
IRA FLATOW: And I’m also looking on the postcards about laughter. And they look among the most whimsical of the data collection drawings that you did. Did you think laughing a lot had something to do with what you drew that week?
GIORGIA LUPI: So sometimes, I think we would pick a visual inspiration from the topic itself and some other times we didn’t. Like in my postcards, I tried to convey the idea of a network of laughter because I was tracking data not only on what I laughed, but also when I made other people laugh. And I think that laughter is truly something that can connect people. So I really tried to, in a way, display it with the visual model.
IRA FLATOW: If someone at home is going to read your book and pick Dear Data and wants to start their own postcard correspondence, what should they do? How should you go about it?
STEFANIE POSAVEC: I think the first thing we would have them do is ask themselves a question, like what interests them, what do they want to know more about their lives? And then, once they have that question, begin to think about smaller questions that they will– think about all the data that they need, that they think they need, to begin to answer this bigger question. And then, I guess, begin to track it.
IRA FLATOW: Is there a fear that you could alienate your postcard friend? By what you collect about one another? Could you say, this week, I’m going to write things that my postcard friend annoys me about?
STEFANIE POSAVEC: I think that would be really– that would be a really wonderful week to do, and I really would like to do that at some point, because I think we’ve learned we didn’t know each other at the beginning of the project. We had only met twice. And so through the year– it’s been two years now that we worked together and we’re really great friends. But there’s like agreements, disagreements, and I’m sure we definitely annoy each other.
IRA FLATOW: We’ll leave that for the next time. Come back and do a postcard.
GIORGIA LUPI: Now, we literally also have a spreadsheet of the design things that we hate about each other.
IRA FLATOW: Just tell [INAUDIBLE] she’d have to make it into a postcard. Giorgia Lupi is an information designer based out of Brooklyn. Stefanie Posavec is a designer, an artist based out of London. They are authors of a great book. Dear Data. So richly drawn. And it’s really a wonderful thing for your eyes to read it.
And it’s also forward by Maria Popova there. She’s one of our favorites too. Thanks for joining us, taking time to be with us this hour. Also we have a beautifully detailed postcard up on our website at sciencefriday.com/data.
Copyright © 2016 Science Friday Initiative. All rights reserved. Science Friday transcripts are produced on a tight deadline by 3Play Media. Fidelity to the original aired/published audio or video file might vary, and text might be updated or amended in the future. For the authoritative record of ScienceFriday’s programming, please visit the original aired/published recording. For terms of use and more information, visit our policies pages at http://www.sciencefriday.com/about/policies
Alexa Lim was a senior producer for Science Friday. Her favorite stories involve space, sound, and strange animal discoveries.