Grade Level
9-12
minutes
1-2 Class Periods
subject
Earth Science
stem practices
Analyzing and Interpreting Data, Developing and Using Models, Engaging in Argument from Evidence
Activity Type:
Northern Lights, particle physics, space
Aurora are truly nature’s light show, but what causes them? What do they have to do with waves? In this assignment, you will examine aurora, energy levels, and some interesting wave activity to create a model that explains why there are different types of aurora. Let’s take a moment to look at some images of different aurora. What do you notice? What do you wonder?
Keep track of your ideas by making a Notice and Wonder chart in your notebook or on your Discrete Versus Diffuse Aurora Worksheet.
Did you notice that there are bright lights that appear to float in the night sky? Do you see that they have different colors? Perhaps you noticed the brilliant green and even some pinkish tones in some. What do you notice about the landscape they appear above? You might have noticed that it is dark and might be nighttime.
Those colorful displays of lights that you observed above are called aurora and they are visible at high latitudes near the Arctic and Antarctic Circles. But what causes them? And why are they all a little different from one another?
What Are Auroras?
Let’s explore a bit more about auroras to see if we can understand how they form. Either watch the video below or dive into a short reading about aurora. Add important information to your Discrete Versus Diffuse Aurora Worksheet.
Develop A Visual Model To Explain Auroras
Modeling is the practice of representing processes or events (phenomena) to explain what is occurring or even to predict what will happen. Models also help us show what cannot be seen; for example, with a model, we can show the movement of molecules in a substance—something we cannot see with our naked eye. Models also allow us to show time passing if it helps us represent a phenomenon.
Create a visual model on your Discrete Versus Diffuse Aurora Worksheet or in your notebook that explains your current ideas about what might be going on with aurora.
- Remember to label the parts of your model so that another person can understand what you are trying to explain.
- If you are unsure, you can add questions to your model to identify components that you cannot yet explain.
- If you want to include the passing of time, you can use panels to indicate different moments of the timeline.
Why Do Some Aurora Look Different Than Others?
Now that you’ve developed a model of what you think is happening when aurora form, let’s compare two different auroras to develop some questions about appearance.
- Examine the two auroras above. How are they similar and different? Do they have the same color, brightness, shape? Record what you notice and wonder about them on your Discrete Versus Diffuse Aurora Worksheet.
You might have noticed that one appears hazy, while the other appears to have more discrete lines. Aurora with a hazy appearance are called diffuse aurora and those with more discrete lines are called discrete aurora. What causes these different types of aurora to appear in the sky?
To figure this out, let’s look at data from two different satellites, Polar and Fast Auroral Snapshot Explorer (FAST). The Polar satellite operates at a higher altitude than the FAST satellite, so we are able to compare power during active aurora from two different altitudes.
- Look at the power data for the two different satellites. Record what you notice and wonder about it on your Discrete Versus Diffuse Aurora Worksheet.
- Take a moment and go back to your visual model. What new ideas can you add to your model? Are there any new questions?
You probably noticed there is a difference in the energy measured by each satellite. But where did the energy go? It had to go somewhere, so let’s think about how particles can be moved.
What Has Happened To The Energy?
Where did the energy go? How can electron particles be moved? What are some ways that we can move electrons?? One way to think about energy is to think about ocean waves.
Watch this video of surfers catching waves and record your noticings and wonderings on your Discrete Versus Diffuse Aurora Worksheet.
Which surfers catch waves and which don’t? What is different about each group?
Going back to our electrons. How could we know if the auroral eletron movement was a result of waves?
When electrons come from the sun they will have a random distribution, so we can model the expected and actual energy distribution by making a histogram.
- Look at the two data sets above. The data shows electrons moving at different velocities as they come from the sun. Note: The data has been simplified to make it easier to work with.
- Use the data sets and make histograms (see sample in the presentation) from them, either using Google Sheets or by hand. Put the velocity on the X-axis and the number of electrons on the y axis.
- What do you notice and wonder about the two data sets?
- Look at the velocity graphs above. How do they relate to what we have been talking about?
- Add any new ideas you have to your model.
So What Is Accelerating Those Electrons?
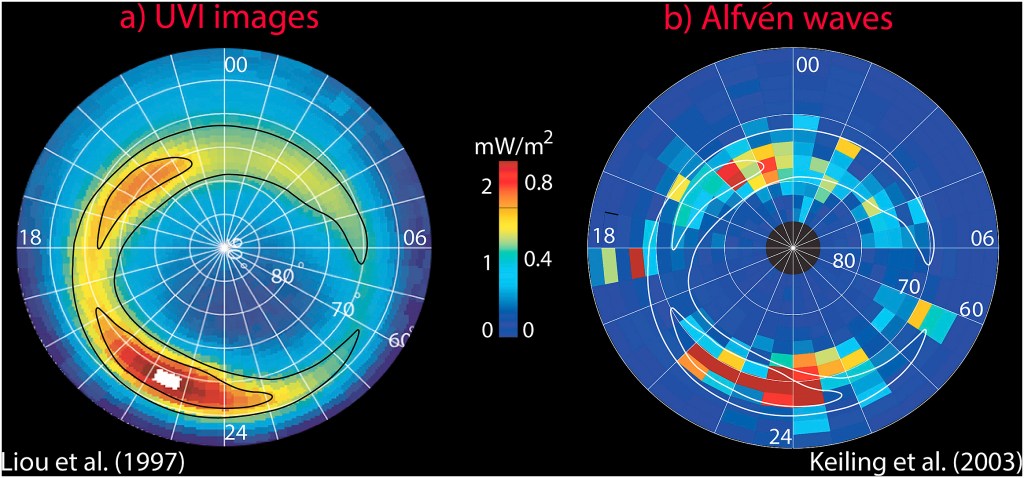
- Look at the Alfvén wave and aurora location graphs above. What do you notice? Based on what we have figured out so far, what do you think is happening?
- Add any new ideas you have to your consensus model.
You just investigated a phenomenon that has been wondered about for a long time. After scientists determined what was creating the lights and colors of aurora, they wondered why some showed intense and bright streaks of light instead of filling the sky with diffuse light. The ideas of Alfvén waves had been proposed, but no one had been able to confirm that these waves were moving the electrons and producing the streaks. In 2018, Jim Schroeder and several collaborators were able to experimentally demonstrate a clear causal relationship between Alfvén waves and accelerated electrons that directly cause auroras. They wrote a scientific paper on their work and it was published in Nature Communications in 2021.
Additional Resources
- Jim Schroeder breaks down the work from the 2021 Nature Communications paper in his article Electrons Surfing On Alfvén Waves, which answers if Alfvén waves can accelerate electrons.
- Learn more about aurora in this video resource bank from the University of Alaska Museum of the North. This collection includes “Can you tell me about the northern lights?“, a film exploring how some of Alaska’s indigenous peoples describe and experience the aurora borealis.
- Learn to see the aurora and report your sightings with Auorasaurus, the first and only citizen science project that tracks aurora.
Next Generation Science Standards
This resource can be used to work toward the following performance expectation:
- HS-PS3-5 : Develop and use a model of two objects interacting through electric or magnetic fields to illustrate the forces between objects and the changes in energy of the objects due to the interaction.
![]()
This resource is part of Science Friday’s Educator Phenomena Forum and was developed collaboratively by Laura Hollister, a K-12 geophysics educator, and Jim Schroeder, a physicist studying plasma waves that transport energy and their interactions with electrons and ions that lead to northern lights and radiation belts.
Check out the folder of classroom resources.
Credits:
Written by Laura Hollister
Edits by Xochitl Garcia
Advice and Review by Jim Schroeder
Digital Production by Xochitl Garcia and Diana Montano
Meet the Writers
About Laura Hollister
@Xeno_lithLaura Hollister lives in California’s Central Valley, where she has been an Earth and Environmental Science educator for 18 years. She is passionate about using place-based and inquiry style teaching to help students develop an understanding of the process of science, their own ability to do science, and its relevance to their lives. She holds a B.S. in Geology from CSU Stanislaus and an M.S. in Environmental Geology from Mississippi State and is the past president of the National Association of Geoscience Teachers Teacher Education Division.
About Jim Schroeder
@mostlyplasmaJim Schroeder is an experimental plasma physicist and Assistant Professor at Wheaton College in Illinois. In a universe where over 99% of what we see is made of plasma, he focuses on plasma waves that transport energy and their interactions with electrons and ions that lead to northern lights and radiation belts.