Was The Flu Near You?
16:28 minutes
![]() This is part of our collaboration with Flu Near You to track the flu over the 2018-2019 flu season. Want to help out? Sign up at Flu Near You, and text ‘flu’ to 917-242-4070 to get weekly reminders and tips.
This is part of our collaboration with Flu Near You to track the flu over the 2018-2019 flu season. Want to help out? Sign up at Flu Near You, and text ‘flu’ to 917-242-4070 to get weekly reminders and tips.
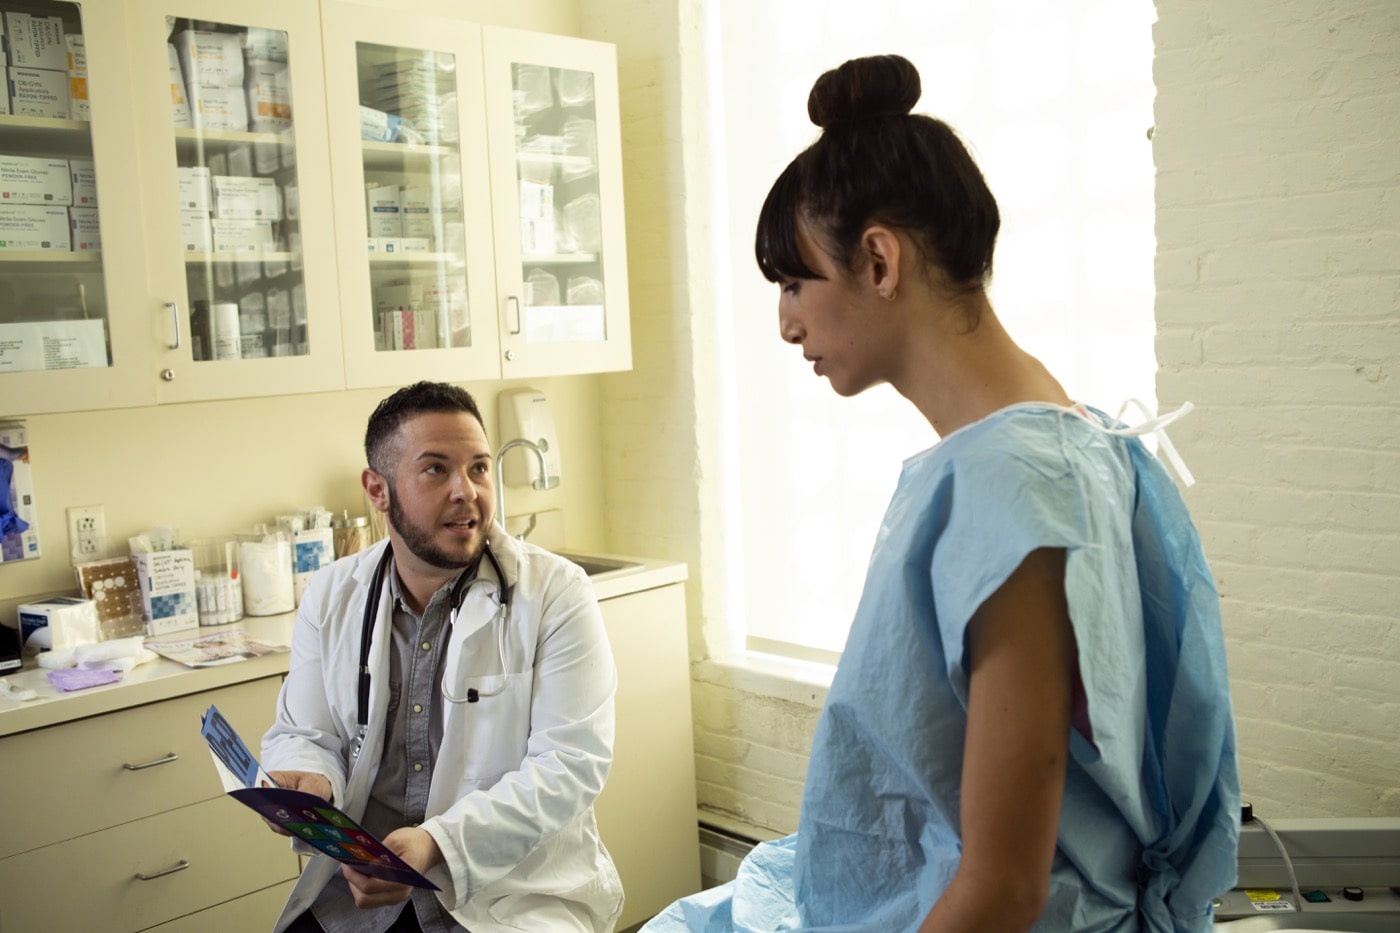
This flu season, Science Friday teamed up with Flu Near You to ask listeners to track their symptoms to create a map of influenza-like illness across the country. Nearly three thousand SciFri users participated.
Science Friday education director Ariel Zych and biostatician Kristin Baltrusaitis, who was a research assistant for Flu Near You, tells us how the SciFri community results stacked up to the rest of participants. According to the data, a larger number of SciFri participants might be vaccinated and better at reporting symptoms compared to the larger population. You can see a full breakdown of the results below.
Plus, epidemiologist Karen Martin gives an update on how this season compares to years past and how the Minnesota Department of Health uses Flu Near You data for surveillance on a local level.
The percentage of participants with influenza-like illness (ILI). Credit: Fernando Donaire/Flu Near You (Source)
We don’t know for sure why Science Friday audiences appear to be a bit more healthy than average Flu Near You users, but we can speculate!
Science Friday participants may be less-susceptible to influenza than average.
Influenza susceptibility varies from person to person; children under 5, adults over 65, pregnant women, individuals in long-term care facilities, and people with asthma, are all at higher risk. If fewer Science Friday participants were reporting for children in their household, or are younger on average than other Flu Near You users, that could account for the difference.

A larger proportion of Science Friday participants might be vaccinated against influenza.
Receiving the influenza vaccine is still the best way to decrease your risk of getting the flu in any given flu season, maybe SciFri participants are fans of flu shots?
Katie, responding from Missouri via our flu texting group, offered a similar thought:
“Ariel, you remarked a few weeks ago that our groups seemed unusually healthy. I gotta say, look at our demographics. I suspect NPR listeners might be a bit more educated, a bit more health conscious, bit more inclined to get a flu shot.”
At first glance, SciFri participants don’t appear to be special in this way:
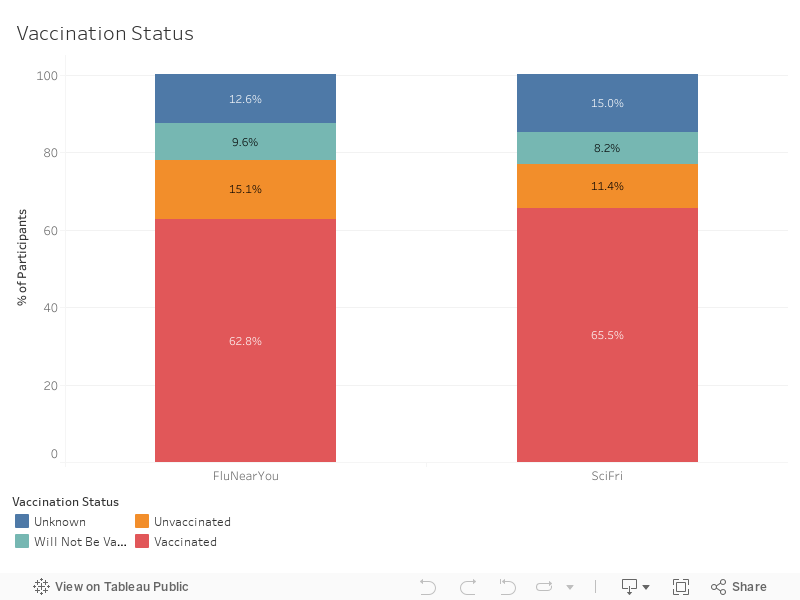
Science Friday participants might report their vaccination status more accurately.
Self-reported vaccination status is a tricky thing. An individual who indicates on a form that they got a flu shot this year may not actually be vaccinated against influenza. It could be that they don’t know that they need a flu shot every year, don’t want to share that they have no plans to get a flu shot, or that they can’t recall correctly whether or not they got a flu shot this year.
Given that the self-reported vaccination rate is about the same in Science Friday participants and Flu Near You participants, if Science Friday participants are more knowledgeable, honest, or accurate about their vaccination status, we would expect a smaller proportion of them to get sick over the course of the flu season than average Flu Near You participants.
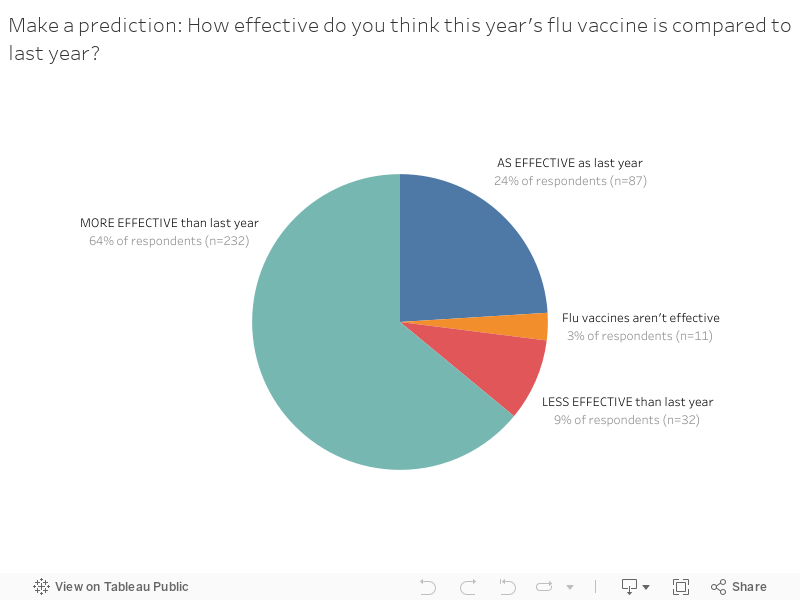
There are hints that Science Friday participants rely on vaccination to help prevent influenza. When we asked the folks who got weekly influenza text reminders to predict how the effectiveness of this year’s vaccine compared to last year’s vaccine, most respondents thought (correctly) that this year’s vaccine was more effective than last year’s—just 3% thought that the flu shot in general is ineffective against influenza.
Science Friday participants might be better at reporting when they are feeling well.
One of the challenges of monitoring the prevalence of any disease is that people are more likely to share when they are feeling sick than when they are feeling well. A participant who logs into a platform like Flu Near You once to say “I have the flu!” and never reports again is unknowingly inflating, ever so slightly, the observed percentage of participants with flu-like-symptoms over the course of flu season.
Looking at average reporting habits, Science Friday users did report slightly more consistently (49%) than Flu Near You users (46%) on average.
Our flu text campaign was conducted using the Groundsource platform and supported by a grant from Community Listening and Engagement Fund from The Lenfest Institute for Journalism. Special thanks to Kristin Baltrusaitis for organizing this data, and to Fernando Donaire and the rest of the Flu Near You staff!
Invest in quality science journalism by making a donation to Science Friday.
Ariel Zych was Science Friday’s director of audience. She is a former teacher and scientist who spends her free time making food, watching arthropods, and being outside.
Kristin Baltrusaitis is a former research assistant for Flu Near You, and a graduate student in Biostatistics at
Boston University in Boston, Massachusetts.
Karen Martin is a Senior Epidemiologist with the Minnesota Department of Health in St. Paul, Minnesota.
IRA FLATOW: This is Science Friday. I’m Ira Flatow. We can finally say it– spring is officially here. The days are getting longer and warmer. We’re at the tail end of the flu season, though not quite done yet.
This flu season, we teamed up with Flu Near You, a citizen science project to track the flu’s spread across the country in real time. We asked you, faithful listeners, to help out by tracking your symptoms. And boy did you answer the call. You briefly broke the internet– did you know that– and Flu Near You’s website in the process.
So what did the flu look like this season? And within our SciFri community, here to tell us all about it are my guests Kristin Baltrusaitis was a research assistant for Flu Near You. She’s also a biostatistics graduate student at Boston University. Welcome to Science Friday.
KRISTIN BALTRUSAITIS: Thank you for having me.
IRA FLATOW: I hear you’ve been plated with your PhD. Is that right?
KRISTIN BALTRUSAITIS: Yes, I’m a three-day-old doctor.
IRA FLATOW: Oh, [LAUGHS] congratulations. I hope your mom’s happy.
KRISTIN BALTRUSAITIS: Thank you so much.
IRA FLATOW: And Ariel Zych, she’s Science Friday’s education director. Ariel, welcome to Science Friday.
ARIEL ZYCH: Hello, Ira.
IRA FLATOW: OK. Kristin, first, congrats, as I say, on your minted PhD. But remind us how Flu Near You works. What are you asking people to keep track of?
KRISTIN BALTRUSAITIS: So essentially, we refer to Flu Near You as a participatory syndromic surveillance system. What we mean by that is we recruit a cohort of citizen scientists across the country to report every week whether or not they have any symptoms. And from those symptom reports we can kind of track influenza-like illness within the general population.
IRA FLATOW: And, Ariel, how many SciFri listeners participated?
ARIEL ZYCH: Well, we did so well. By the time all was said and done, everyone registered, we had just over 2,900 active users for the length of the project, which means we had 2,900 people reporting their weekly flu symptoms. And they were even doing it for other people in their household. So the whole Science Friday cohort represented about 3,500 people.
IRA FLATOW: Wow. We broke the internet, you say?
ARIEL ZYCH: We did. Yes, yes, when we first announced that people could sign up, members of Science Friday’s audience from all 50 states flooded to the site, immediately tried to register, immediately broke the website. We fixed it. And those who hung on with us, they’ve turned out to be really good reporters. So part of the fun of syndromic surveillance is that data, even when you’re feeling well, that’s good data. So we ask people to report every week. And Science Friday listeners, you guys did so well.
IRA FLATOW: They came through.
ARIEL ZYCH: Yes, they really did.
IRA FLATOW: And you found out some surprising facts too– like whales get the flu.
ARIEL ZYCH: Yes, that’s right. So every week we sent a little text reminder to our participants who wanted them to kind of remind them to log their symptoms. But we also sent some fun flu facts. And we learned things like influenza viruses, especially influenza A viruses, are very promiscuous. They jump around all sorts of species. So whales can get sick with it. And so do seals and ferrets and minks. And you know, while those are dead-end hosts, they get infected by some of the same routes that other people do– so just through contamination of water.
But we also learned some fun things like that there’s a Black Friday for flu symptoms in outpatient clinics. So everybody stays home for Thanksgiving. They get lazy, or they don’t feel like going to the doctor over a holiday. And so if you’re looking at influenza-like illness, for instance, in the Flu Near You population, you’ll usually see a spike in outpatient clinics for people showing up with these flu-like symptoms because they kind of held off until the day after Thanksgiving to check in. So we learned a whole bunch of fun flu natural history as a part of this process.
IRA FLATOW: That’s great. Dr. Baltrusaitis, the CDC keeps track of influenza. How can stuff that we do give us a different picture?
KRISTIN BALTRUSAITIS: So the CDC has a really well established influenza surveillance system. However, their surveillance depends upon individuals going to the doctor. Our system differs because we look at the entire population. So most people that do have influenza-like illness don’t actually go to the doctor. So the goal of our system is to kind of capture those individuals as well. And then we can provide the CDC with additional information– like what percent of those individuals that are experiencing the symptoms actually do go to the doctor? So we think about this as a very complementary surveillance system to the CDC.
IRA FLATOW: Can you tell how this flu season went from the point of view of Flu Near You? What trends did we see? How well did the vaccinations work? Stuff like that? Kristin?
KRISTIN BALTRUSAITIS: So we can look at influenza-like illness. So we can look at those that are vaccinated versus unvaccinated. We use influenza-like illness, which is a proxy for actual influenza. So we look at the symptoms that are very consistent with influenza. So we can’t actually look at vaccination effectiveness. But we can look at what proportion of individuals within the population are actually vaccinated and whether or not they’re experiencing symptoms that are related to the flu.
IRA FLATOW: And Ariel, as you say, Science Friday listeners certainly heeded the call. How did our listeners compare to the rest of the Flu Near You population?
ARIEL ZYCH: So that was something that I was really interested to think about because I think our audience is a unique bunch of people, but also because we had assembled this around right at the beginning of the flu season. And I was thinking, I wonder how they’re going to be different? And we did find some interesting things.
So I mentioned that they were good reporters. They reported just a little more consistently than Flu Near You users did on average. But there were also some other interesting differences. They seemed to get sick less often. At any given point in time, a smaller proportion of Science Friday users were experiencing influenza-like illness, or those influenza symptoms we talked about, than average.
And so that kind of piqued my interest a little bit. I was thinking, well, what is it? You know, maybe it’s that they’re all super vaccinated, so we just have a really high vaccination rate. But when we started taking that apart a little bit, it looked like their vaccination rates, at least their self-reported vaccination rates, were similar to a general audience.
And so, you know, that kind of led down this rabbit hole of what could be going on? And why are Science Friday listeners so healthy? And that’s one of the fun things about a project like this is I think there’s still a lot to learn about this type of monitoring.
IRA FLATOW: Kristin, do you have any explanations for this? Are our listeners extra healthy? Or is this due to how they might be reporting their symptoms?
KRISTIN BALTRUSAITIS: Everything that I thought, it was like, well, maybe there’s differences in ages, and there’s fewer younger individuals. But the population distribution looks very similar to Flu Near You. So I guess we just have a really healthy Science Friday population.
[LAUGHTER]
IRA FLATOW: We’re very happy with that.
ARIEL ZYCH: We did find that there were a lot of young people in that cohort. That was a really pleasant surprise. So Science Friday users, we expected them to be fairly evenly distributed across age groups. But it turned out, Kristin, we had a fair number of teenagers participating, didn’t we?
KRISTIN BALTRUSAITIS: Yeah. Approximately 15% of the users were in the 13 to 17 age range.
IRA FLATOW: That’s terrific.
KRISTIN BALTRUSAITIS: Which is really exciting that we’re getting these younger individuals interested in science and citizen scientists.
IRA FLATOW: Were happy to hear that. I want to bring on another guest who uses this information on the ground– Karen Martin senior epidemiologist at the Minnesota Department of Health in St. Paul. Welcome to Science Friday.
KAREN MARTIN: Hello, and thank you for having me.
IRA FLATOW: So how has the Minnesota Department of Health used this data that Flu Near You tracks.
KAREN MARTIN: Well, we’ve been working with Flu Near You data for a couple of years now. And Minnesota was one of two states this past year that received a small amount of funding to work on a project that we call Confirmed Flu Near You, where we’re actually looking at the users within our state and then thinking, what would happen if we sent the users– ask them if they want to sign up for an enhanced surveillance, and sent them some swabs along with some mailing kits, and ask them when they got sick, if they would do a self-swab in the nose, package it up, and send it to our public health laboratory for us to test? And so we are looking at not only reports of influenza-like illness from Flu Near Your users in our state, but we’re also getting a subset of samples so that we can see, of those who are reporting illness, what actually do they have? And so that’s been really interesting to see.
And as I think it was mentioned before, this is really giving us a window into a population that we don’t have a lot of information about. So while we normally have a lot of data on medically attended influenza– people who are going to the doctor’s office, people going to the hospital– we really have little information on people who are sick but are not going to the doctor’s office. So this is really a great opportunity to see what’s going on in that population.
And what we’ve found is we are finding flu. We did find some influenza. And in addition to influenza, we tested it also for some other respiratory pathogens. And just like you would expect, it’s a little bit of a viral soup, some other things going on there.
But one interesting thing that we did find– as every flu season is interesting, I should say– is that we did see sort of a change from the dominant strain in the Flu Near You data. So at the beginning of the season, we were seeing more influenza AH1. But towards the middle, towards the end this season, we are seeing it switch over to influenza AH3. And that was reflected in our other data as well. So like I said, it’s given a nice supplement to the rest of our influenza surveillance data.
IRA FLATOW: How would you compare this to last season? If I recall, last year was a pretty severe flu season, was it not?
KAREN MARTIN: Yes, last season was record breaking in a number of ways. I mean, we had a record number of hospitalizations, record number of deaths due to influenza– a lot of the indicators that we use to describe how severe a season it was. And certainly, I want to say, any influenza season is severe. And we do have people that get very sick and died. But certainly, it was nowhere as severe as it was last season. So for that, we’re grateful.
IRA FLATOW: We are. So how much longer do we have to endure the season?
KAREN MARTIN: [LAUGHS] Well, that is the million dollar question. But I think it’s safe to say that we certainly have several weeks left of activity. And it could depend on what part of the country you’re in. But at least in Minnesota, we really just hit peak activity within the past couple of weeks. So we’re really still expecting high activity in the weeks to come. So we’re definitely not out of the woods yet.
IRA FLATOW: You know, speaking of last year, adding to the severe flu outbreak, we also did not have a vaccine that worked very well. How is the cocktail this year working?
KAREN MARTIN: As a cocktail– yeah, I like that expression. Well, you know, unfortunately, the vaccines that we’re able to produce right now are not 100% effective. So you’re always going to have the possibility of getting a vaccine and still potentially getting the flu. So for this season, I believe it’s in the upper 40s as far as percent effective. But that for getting influenza.
Now, if you look at other outcomes, such as being hospitalized for influenza or dying of influenza, the efficacy is going to be much higher. So definitely still worth it. But you know, I think the search is on for a vaccine that does have better efficacy but definitely still worth it to get vaccinated.
IRA FLATOW: I’m Ira Flatow. This is Science Friday from WNYC Studios, talking about the Flu Near You with Kristin Baltrusaitis, Karen Martin, and Ariel Zych and about this flu season. When we say flu map, Karen, some people think that you’re trying to make a weather forecast for the flu. But you’re interested in surveillance, right? There is a difference.
KAREN MARTIN: Yes, I’m sorry. Did you say, Karen?
IRA FLATOW: Yes.
KAREN MARTIN: Yes, for surveillance, yes. So right now with flu– the difficulty with flu is that it is, and I think it was mentioned before, the virus is constantly changing. And so what we are trying to do is we are trying to gather enough data and surveillance data. It’s finding out who is getting sick, and are there certain groups or certain people who are getting disproportionately affected? So that we can better target our interventions– be that vaccination, or do we need to get some better public health messaging about how to better prevent the spread of disease? So when we put out maps and talk about surveillance, we’re really talking about who is sick, and where are they sick?
IRA FLATOW: Kristin, how many people do you need to report to be able to make a surveillance map?
KRISTIN BALTRUSAITIS: So based upon some of our studies, we’ve noticed that if you have like about 300 to about 500 individuals within a given geographical area, you can track the ILI symptoms within that population fairly well. Obviously, the more individuals that you have, the better your estimates will be. So we encourage everybody to participate.
IRA FLATOW: And so you’ll be collecting data all year round, right?
KRISTIN BALTRUSAITIS: Correct.
IRA FLATOW: How can people participate? Go to our website?
KRISTIN BALTRUSAITIS: Yes. If you go to Flu Near You, you can register to be a reporter. And we do encourage individuals to report all year round. So we don’t just track symptoms associated with influenza. We track other symptoms.
So a few years ago, back in 2014, there was an outbreak of the [INAUDIBLE] virus. Even though that was in September and prior to the start of that flu season, we were able to kind of track that virus within our population. So it’s important that we get these baselines all throughout the year.
IRA FLATOW: Always important. And Ariel, can people go over to the SciFri stat site and look it up, stuff they want to see?
ARIEL ZYCH: Yes, yes, please come and navel gaze with us, look at how you guys all fared. I think, you know, we mentioned the percentage of individuals in Science Friday’s cohort who got sick. That percentage over time is available on our site on sciencefriday.com. You’ll see the link right on the home page. But also browse a little bit through and explore some of the differences between cohorts. Certainly, I think you’ll be surprised at some of the things we found and didn’t find when we started making some of those comparisons.
IRA FLATOW: Dr. Martin, one last question a little bit out of left field for you, as a senior epidemiologist, because I have you here on the phone.
KAREN MARTIN: [LAUGHS] All right.
IRA FLATOW: Do you think we will start to track measles outbreaks?
KAREN MARTIN: Well, we definitely are tracking measles outbreaks. And you know, unlike flu, where we cannot track every case, we are definitely doing our best to track every case of measles. But as far as on something like Flu Near You, you know, I would hope that every case of measles would be immediately reported to a health care facility and a health department, rather than just on the internet. But I think it does have the potential to track other types of diseases, such as a rash illness. But I would hope that measles in particular would have a little more urgency. But that’s my opinion.
IRA FLATOW: Karen Martin, senior epidemiologist at Minnesota Department of Health in St. Paul, Kristin Baltrusaitis, research assistant for Flu Near You, and Ariel Zych, Science Friday’s education director– thank you all for taking time to be with us today.
ARIEL ZYCH: Thanks so much, Ira.
KAREN MARTIN: Thank you.
KRISTIN BALTRUSAITIS: Thank you.
IRA FLATOW: And as Ariel says, you can go to our website to see those Flu Near You stats. And we also have an article up there where you can see the flu virus. You can see it up close under an electron microscope. It’s pretty interesting to look at. Go to sciencefriday.com.
Copyright © 2019 Science Friday Initiative. All rights reserved. Science Friday transcripts are produced on a tight deadline by 3Play Media. Fidelity to the original aired/published audio or video file might vary, and text might be updated or amended in the future. For the authoritative record of Science Friday’s programming, please visit the original aired/published recording. For terms of use and more information, visit our policies pages at http://www.sciencefriday.com/about/policies/
Alexa Lim was a senior producer for Science Friday. Her favorite stories involve space, sound, and strange animal discoveries.
Ariel Zych was Science Friday’s director of audience. She is a former teacher and scientist who spends her free time making food, watching arthropods, and being outside.
Dee Peterschmidt is Science Friday’s audio production manager, hosted the podcast Universe of Art, and composes music for Science Friday’s podcasts. Their D&D character is a clumsy bard named Chip Chap Chopman.
Ira Flatow is the founder and host of Science Friday. His green thumb has revived many an office plant at death’s door.