How Young Learners Engaged With Sun Science At Home
A virtual camp with live Q&A and hands-on activities led to nearly 2,700 children learning about the physics of the solar system.
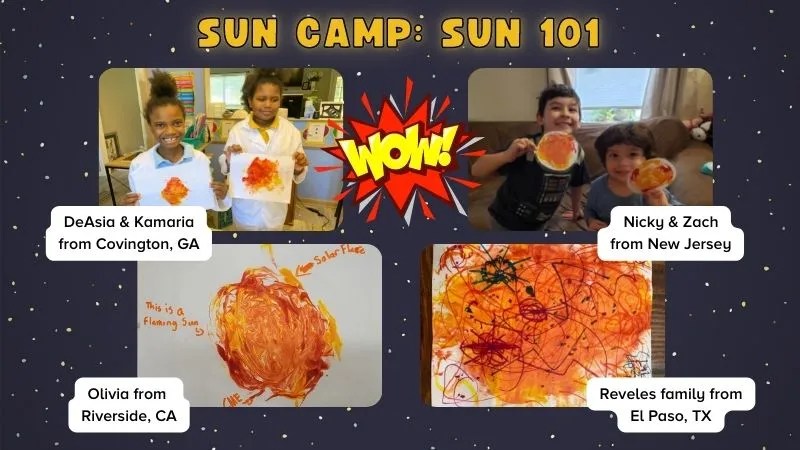
In the Fall of 2022, Science Friday’s new Education Program Manager, Sandy Roberts, had a huge undertaking as her first program—tackling heliophysics, the study of the Sun and its impact on space as a dynamic system. Her goal was to make solar physics and phenomena accessible to young children. Her approach: A free, virtual heliophysics program, complete with materials kits and live expert Q&A. The camp would leverage subject matter experts and resources from the NASA Heliophysics Education Activation Team (HEAT) community to provide high-quality, hands-on STEM for learners ages 5-9 and their caregivers. The Science Friday Sun Camp program was launched online in mid-October and lasted five weeks.
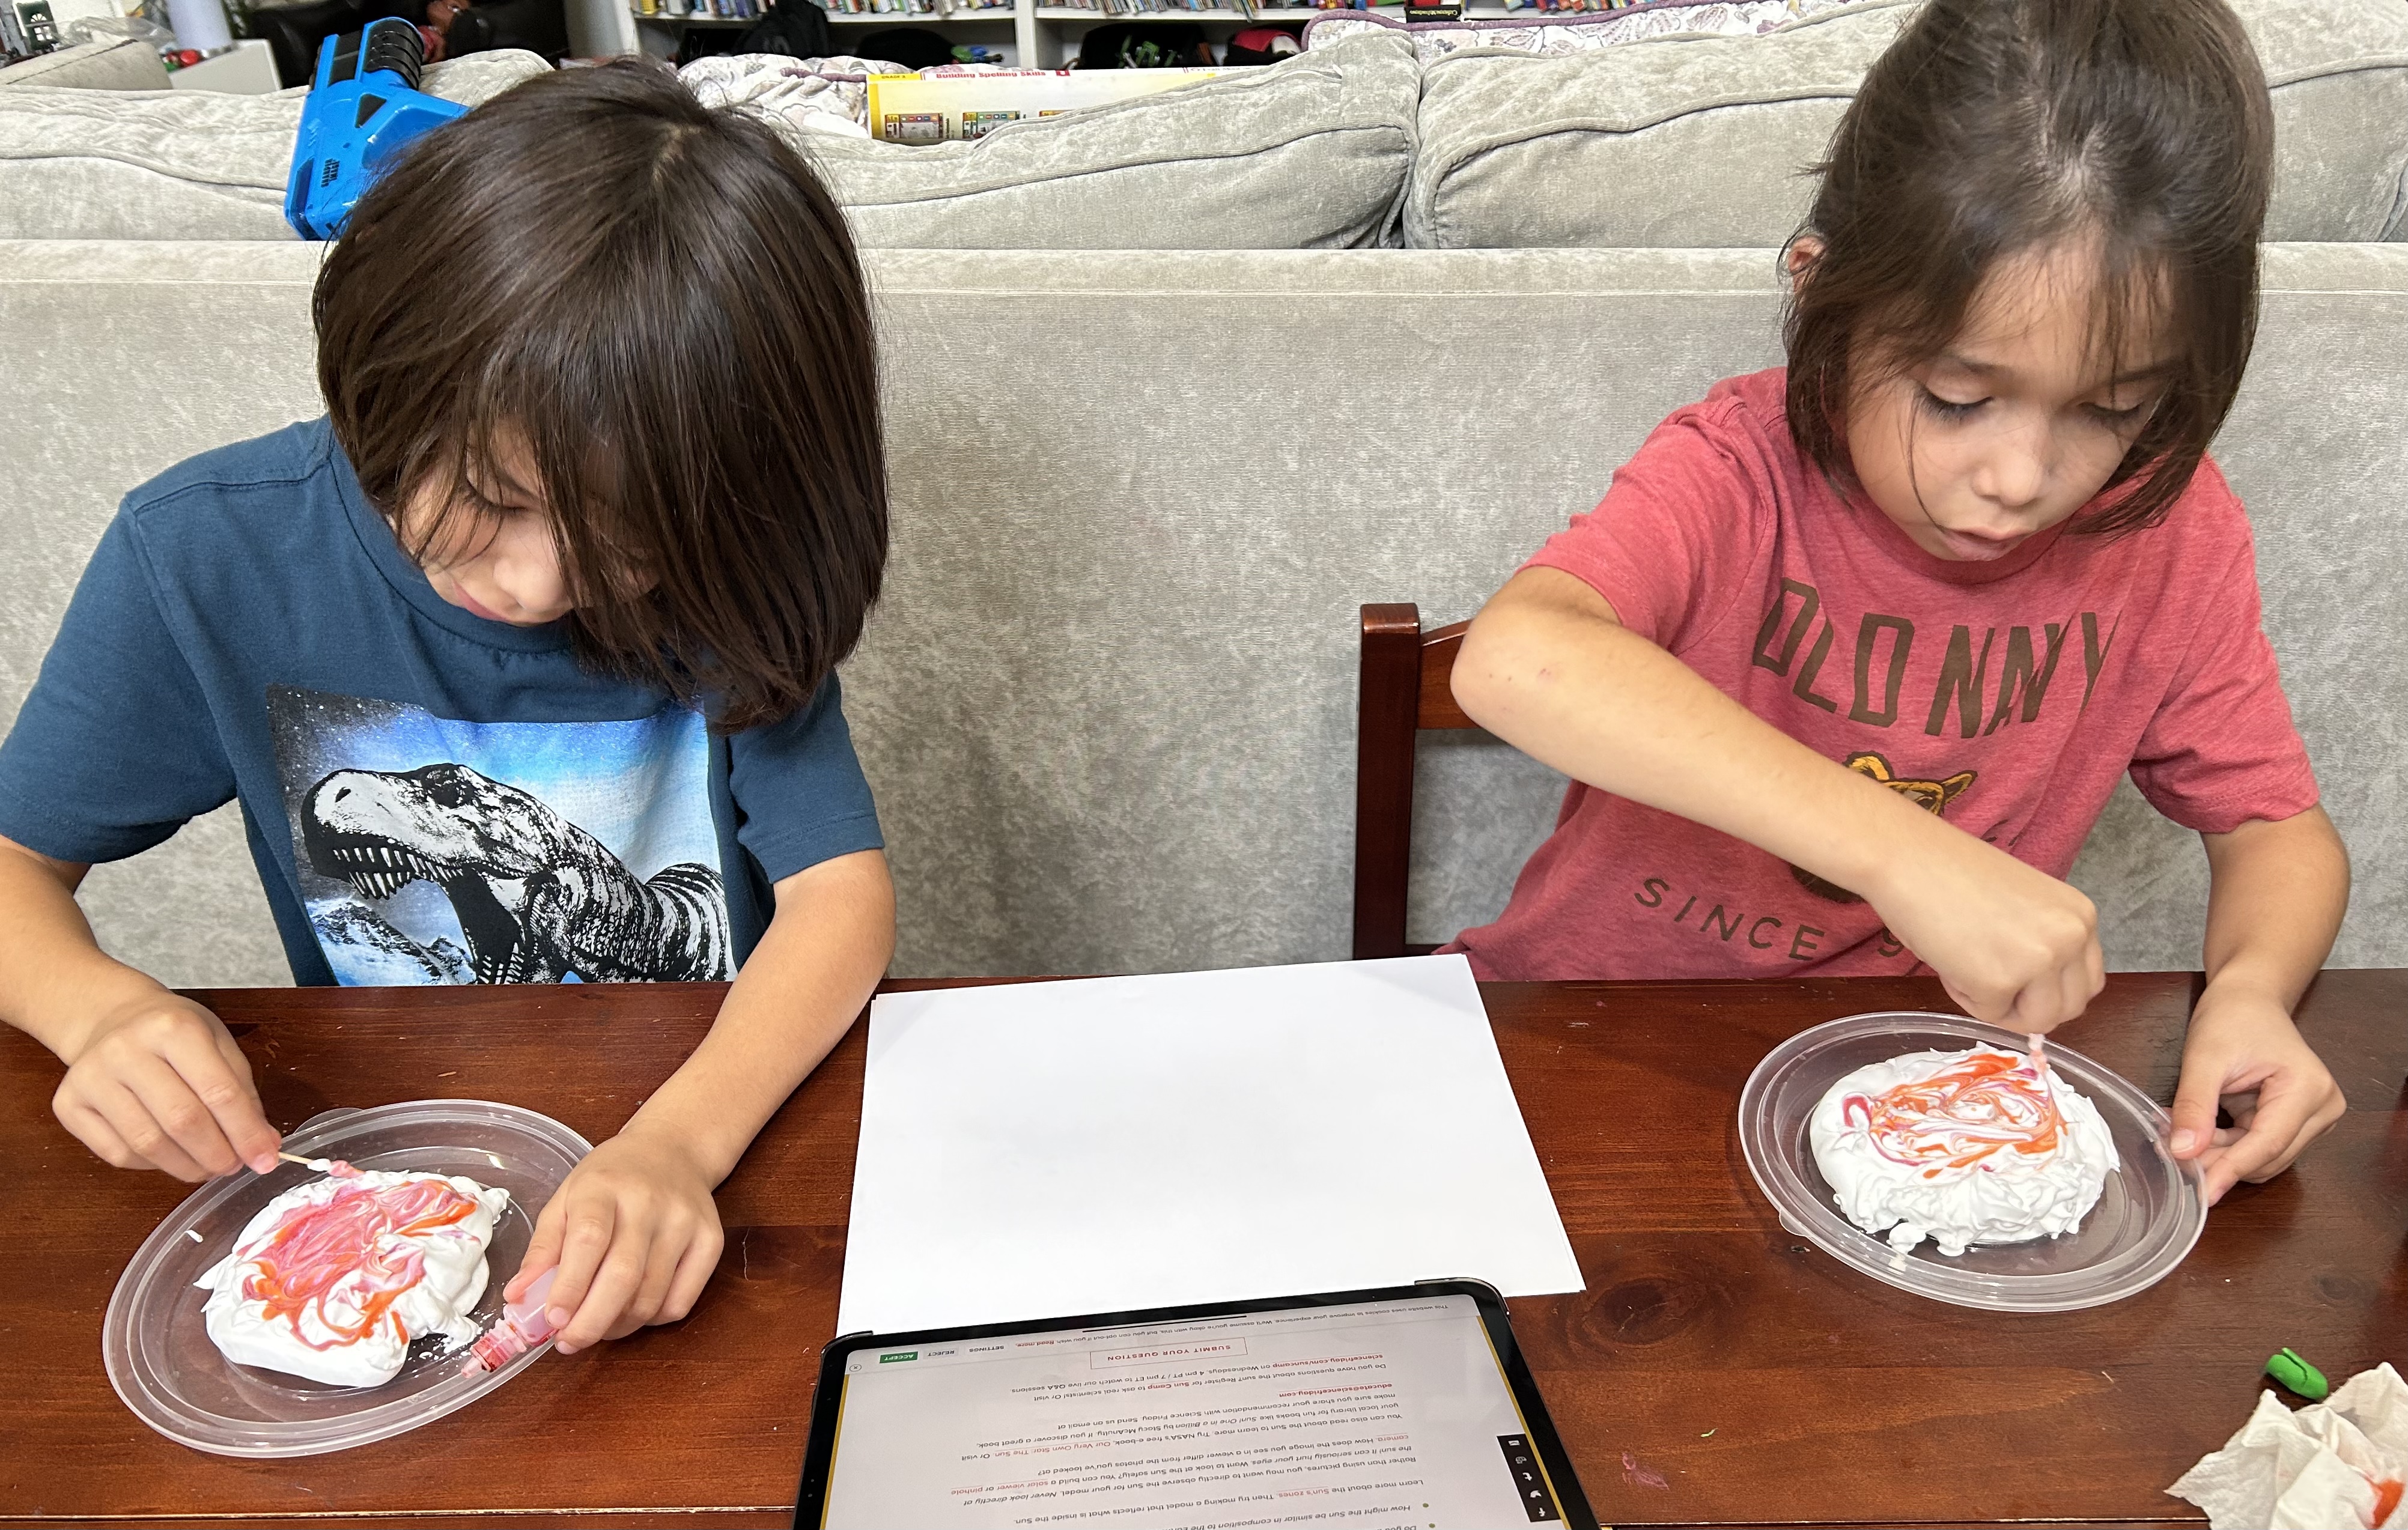
The synchronous component of Sun Camp consisted of weekly live Zoom Q&A sessions with a diverse group of scientists and experts. The asynchronous component included six educational resources featuring activities for participants to complete at home. Sandy sent participants a weekly newsletter with information about the Q&A and resources related to that week’s theme and created a Sun Camp page on the Science Friday website, where all the program activities and events could be found throughout the life of the program and long after.
Most of the materials required for the weekly activities were inexpensive and could be easily sourced by participating families and school settings. Additionally, free materials kits were made available to 100 low-income families and 25 organizations working in Title 1 districts. These kits were mailed in advance of the start of Science Friday Sun Camp and ultimately served over 1,000 learners.
“The lesson plans are extremely well thought out… The experiments are both tactically and intellectually robust. I have nothing but positives to report.”
We took a multi-pronged approach to studying the engagement and learning of program participants. General uptake of the resources was measured using Google Analytics including visits to site, length of time on page, and sharing photos with Science Friday directly or on social media. A feedback survey was deployed to all registrants of the program to assess satisfaction, learning behaviors, and areas for improvement. In the same email to registrants, we included a link to a content assessment created in Google Forms. Presented as a 10 question quiz, the content assessment addressed the primary topics included in the program. The quiz included multiple choice questions (using both text and images) as well as open-ended questions, and was administered to children independently or completed by parents or educators recording the child’s responses.
Sun Camp was designed to address the needs of both formal classrooms and out-of-school-time programs. We recruited schools, libraries, community groups, homeschooling parents, as well as families and caregivers. We targeted outreach efforts to communities with a high proportion of families belonging to marginalized groups who have been traditionally underserved by STEM programming. We used the Elementary/Secondary Information System (ElSi) from the National Center for Education Statistics (NCES) to find public schools serving historically underrepresented communities and identities in STEM, starting with Title 1 schools and then filtering schools with a high percentage of groups such as Black, Latinx, and Indigenous students. This helped us narrow down areas of interest, identified by zip code, which we used to then reach out to libraries, community based organizations, and out-of-school-time practitioners that served our target populations.
We also identified organizations such as the National Girls Collaborative Project, the American Indian Science and Engineering Society, Out to Innovate, Afterschool Alliance, and National Alliance of Black School Educators and asked them to share the program with their membership. Lastly, we reached out to library programming groups, homeschooling co-ops, and STEM educators through Facebook Groups and email lists and newsletters.
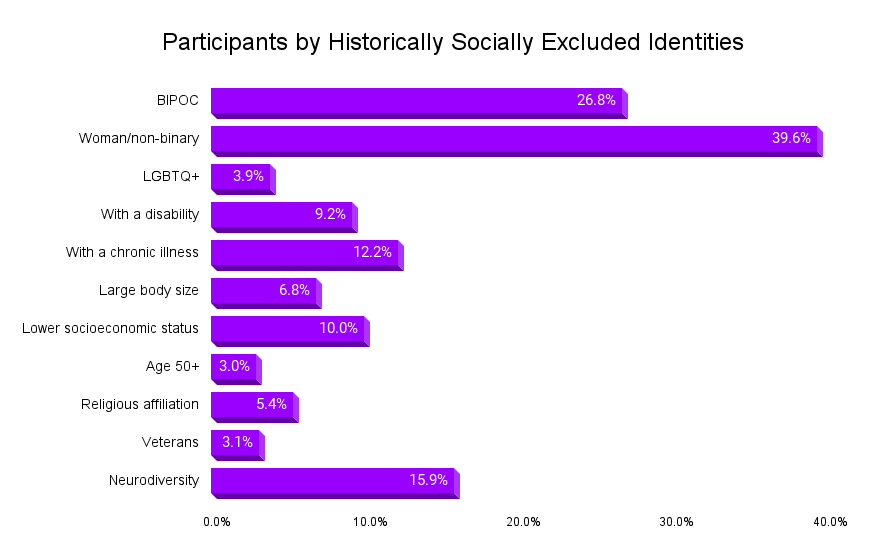
Those efforts appear to have been successful in reaching new audiences. Over 557 families and groups registered. In total, 2,672 children enrolled in Sun Camp. Approximately 54% of Sun Camps were held at schools, 34% at home, and 11% at libraries.
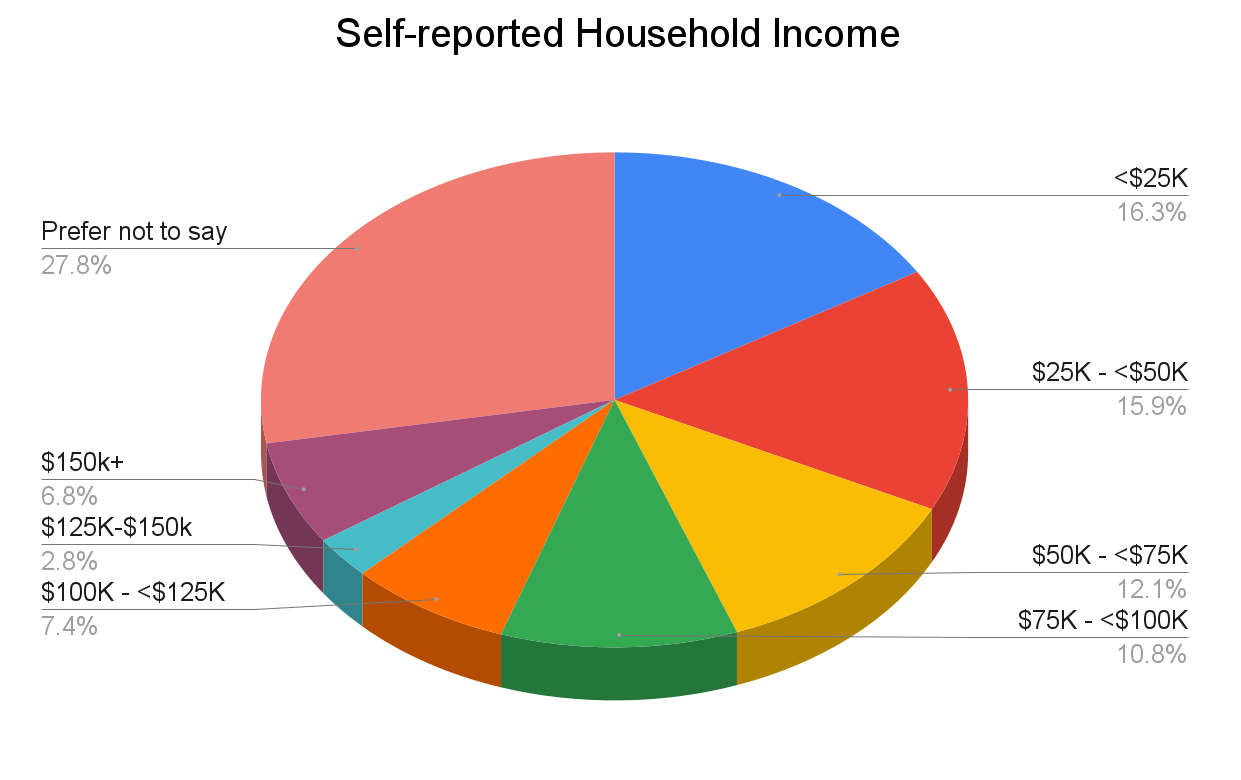
Our participants represented a diverse group of learners (see Figures 1 & 2 below):
Science Friday generated a total of six new educational resources for Sun Camp. To date, they have been viewed over 15,563 times in total. The Sun Camp resource “Gravity And Centripetal Force In Our Solar System” has been, by far, the most popular resource, with approximately 8,106 views, the majority acquired by search.
The Q&A sessions featured a diverse group of subject matter experts in an effort to mirror and provide in group role models to our diverse learners. To ensure a high-level of knowledge and outreach experience among facilitators, we partnered with organizations such as NASA Polarimeter to Unify the Corona and Heliosphere (PUNCH) and Solar System Ambassadors. The Q&As averaged 70 live views per week, and were attended primarily by families.
“My students had interest in the speakers…They liked seeing lots of different ages/genders/skin colors, etc.”
“The kit was wonderful! My students were so excited to complete the projects and using the kit was so easy for me as a classroom teacher.”
Thirty-six registrants completed the post-program survey. More than three-quarters (77%) of survey respondents said they would recommend the program to others. The feedback survey sent to participants indicated 23% of registrants felt their interest and knowledge of Sun science increased during Sun Camp. We asked participants to rate their child(ren)’s interest in Sun science before and after Sun Camp from “1-not at all interested” to “10-extremely interested.” The average interest in Sun science increased in children before and after attending Sun Camp (5.81 vs 8.15). We did not send a pre-program survey— science interest was measured with a single question in the post-program feedback survey. Due to this and the limited number of respondents to this question (N=26) we were unable to test whether this change was statistically significant.
“This was fun! I loved being able to add it to our weekly science schedule in our homeschool.”
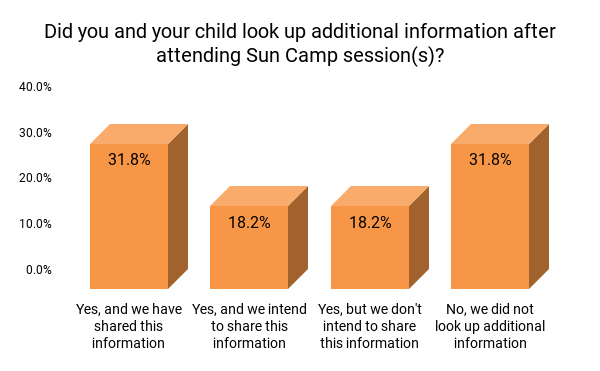
Ninety percent of survey respondents said they learned something new as a result of participation in programming. In addition to learning, information seeking was a key indicator of success to evaluate the effects of programming. Half of all survey respondents said they looked up information after attending Sun Camp and shared or intended to share this information with others. An additional 18% looked up information but did not intend to share. Respondents looked up information and images on general space missions, the Sun, planets, and other space related programs.
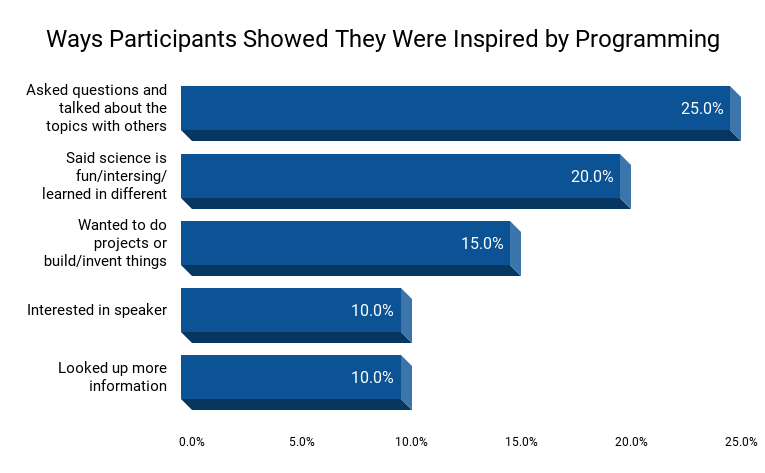
Survey participants were asked what their children said or did to show they were inspired by the program or guest experts (See Figure 4 below). A quarter of survey participants said that their child asked questions about the topics and talked to others about what they learned. Saying science is fun/interesting (20%), wanting to complete projects (15%), interest in the speaker (10%), and looking up more information (10%) were ways children showed that they were inspired by programming.
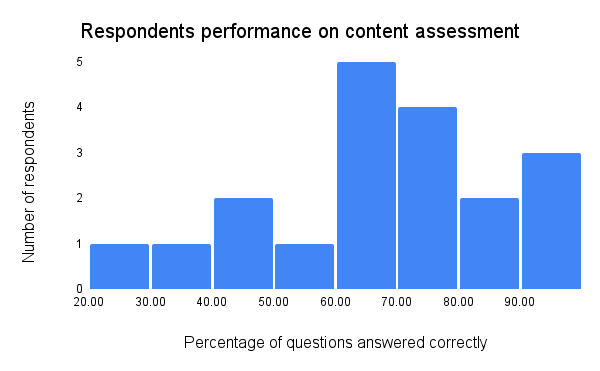
The content quiz was completed by 19 program participants. We aimed for a 70% score (7 out of 10 questions correct) for the content quiz to show comprehension as this would indicate a developing knowledge and understanding of the topics. Open-ended questions and multiple choice questions where participants could check multiple answers were given partial credit if some of the response was correct. The average score was 68%, with understanding of specific concepts ranging from 49% to 89%. Nine of the 19 respondents answered 7 or more questions correctly. Four respondents struggled and answered fewer than half of the questions correctly (23%-45%), which seems to have skewed the overall average score.
Complex concepts (e.g. how aurora form) were harder for participants to retain as compared to concepts like tools used to study heliophysics. A static online quiz may not be an ideal way to assess learning for learners 5-10 years of age, and the questions asked may have been too complex for this age group in an asynchronous setting. For children in these age groups, it may have been more beneficial to talk to them in order to give them the opportunity to explain the concepts and express what they learned. However, this was not feasible due to the limitations of online programming. Future programs may benefit from having the assessment designed or reviewed by educators working with young students. Another possible improvement may be sending a formative assessment upon registration, before Sun Camp began. This may have given us a better picture of knowledge acquisition overall. However, there were concerns that doing so would be seen as a barrier to participation; something worth revisiting in future programming.
Informal assessment of content knowledge was incorporated into the photo and video submission process for the program. Participant responses to the questions “What does it show? What did you learn? How did you feel when you did this activity?” followed similar trends as the quiz. Participants showed a strong understanding of concepts such as properties of the Sun (including features such as sunspots and solar flares) and UV light, but struggled with more difficult concepts such as gravity and inertia. These were topics covered in week one and two, respectively. We had diminishing feedback as camp went on and we approached the Thanksgiving holiday, making it difficult to assess other topics.
Feedback from participants indicated some room for improvement. Notably, classroom educators could not use the Q&A sessions live with their classes because they were held at 7:00pm Eastern to be more convenient for families. Even so, attendance decreased significantly over the course of the program as we approached Thanksgiving. Given the age group, it was challenging to keep participants focused on the weekly theme when asking questions of our experts. They also tended to repeat similar questions. This made the Q&A sessions less focused. In the future, there are strategies we can use to improve these types of sessions. For example, we could have panelists give more of a “TED Talk” at the start. We could ask that questions be prepared in advance and select appropriate participants to present. We could also coordinate with a single classroom of learners each week so that an educator could help guide the discussion, though this would limit the reach of the program.
The vast majority of participants were parents or homeschooling groups. We were unsure of the base knowledge of parents and educators on heliophysics. Because we did not assess the previous content knowledge of the parents and homeschooling groups that registered, we prioritized making the resources and programming shorter to not overburden at-home facilitators. In the future we will consider reframing the program and activities to include not only the background information on concepts discussed but also how to help at-home facilitators communicate key concepts to children. This would provide opportunities for parents and educators to grow their science literacy as well as their ability to communicate difficult concepts to children. By incorporating more communication techniques, we hope in the future to help improve the at-home facilitation of difficult concepts for learners.
“My husband and I had as much fun as the kids did. It really meant a lot to have scientists and educators answering my son’s questions directly.”
One of the challenges we had was the participants’ desire for more step-by-step directions on what should be done as part of the activities. Participants asked for additional instructional video and indicated photographs would have been helpful when completing projects. Some activities were traditional activities where participants were collecting data, however others required participants to design their own projects. This requires a balance of being prescriptive with allowing creative space when designing the activity guides. Incorporating explanatory information into the activities and Zoom sessions would require reframing programming and has a time cost associated with it. This would mean Q&A participants would have less time to ask the experts questions. Providing “explainer” video content has implications for budget that we would need to consider. Creating video content is cost prohibitive, so finding alternative ways to give the desired step-by-step directions is a priority, and could include using static pictures rather than videos.
While there is always room for growth, comments from participants were primarily positive and we will continue to tinker to bring more science joy to audiences.
“They feel inspired to invent stuff and build things like spaceships.”
“Love this! Would love to get involved in more STEM activities.”
“We appreciated the variety of experts, and hearing the kids ask their own questions.”
Nahima Ahmed was Science Friday’s Manager of Impact Strategy. She is a researcher who loves to cook curry, discuss identity, and helped the team understand how stories can shape audiences’ access to and interest in science.
Sandy Roberts is Science Friday’s Education Program Manager, where she creates learning resources and experiences to advance STEM equity in all learning environments. Lately, she’s been playing with origami circuits and trying to perfect a gluten-free sourdough recipe.