How Science Friday Used A/B Testing To Guide Audience Engagement
When the pandemic began, we had to rethink how we engaged with audiences interested in science. Here’s what we learned.
SciFri Findings is a series that explores new practices in journalism and science communication, and their impact on our audiences. Sign up for our newsletter to get the latest reports!
At the start of 2020, we had grand plans for C*Science programming, (often called citizen science, community science, or crowd-sourced science) “crowdsourcing” nonprofessional scientists to participate in scientific research. As offices and schools began shutting down in March 2020 due to COVID-19, we needed to respond to the changing needs of educators, families, and C*Science project researchers. We had to consider: How could we shift our radio, educational, and event programming to fulfill science educational gaps and activate new C*Science volunteers?
We needed to quickly shift to live Zoom events and radio segments that were engaging enough for participants to volunteer for C*Science. Our evaluation for this program included A/B testing different kinds of audio and live event programming formats with audiences. We paired this with a quantitative research study of C*Science volunteer and nonvolunteer attitudes about C*Science and engagement across multiple projects and platforms. Our A/B testing allowed us to experiment with content elements (e.g. messaging, story framing, medium) to measure their relative effectiveness at activating audiences to participate in C*Science projects. The testing allowed us to respond to audience uptake and revise our approaches to extending C*Science invitations. The learnings from that iterative process allowed us to incorporate best practices from Year 1 (2020) into Years 2 (2021) and 3 (2022).
Messaging and framing the events and segments were top of mind for us, as we wanted to see which ones motivated potential volunteers. Our Director of Audience, Ariel Zych, and Experiences Manager, Diana Montano, wanted to adjust programming to better serve audiences during the lockdown by providing virtual opportunities, so that participants could participate while maintaining social distancing.
Do radio segments that are focused on science-stories activate more volunteers for C*Science than radio segments that highlight specific projects?
In 2020 radio staff—including Director and Senior Radio Producer Charles Berquist, and Radio Producers Kathleen Davis and Christie Taylor—produced six radio segments and our audience team—Diana Montano, Ariel Zych, and Education Manager Xochitl Garcia—held seven live stream events featuring nine C*Science projects. These included COVID Near You, Crowd the Tap, ISee Change, City Nature Challenge, Zooniverse including Antislavery Manuscripts, Bash The Bug, Planet Four, and University of Wyoming Raccoon Project, and Satellite Streak Watcher.
The on-air presentations of these projects took two main segment formats to support Science Friday’s A/B testing approach: Story-focused segments and project-focused segments. Story-focused segments led with interviews with subject matter experts about emerging science news in typical Science Friday fashion, but incorporated a related C*Science project at the end as a way to become more involved in related research. Project-focused segments did the opposite, leading with a description of a C*Science project, sometimes interviewing lead researcher for the project or a member of Science Friday’s staff as a project advocate. Story-focused segments included COVID Near You, Crowd the Tap, Satellite Streak Watcher, project-focused segments focused on the City Nature Challenge, ISee Change, and Zooniverse projects.
We also A/B tested volunteer activation by hosting live streamed project introductions for every project that was featured in our on-air radio program.
Mapping the impact of our media required us to use multiple approaches for tracking how many members of Science Friday’s audiences were turned on to projects by our programming. Data collection and sharing capabilities are unique to each C*Science organization and platform, and Science Friday and partners wanted to prioritize user privacy concerns.
We had some challenges obtaining data from partners, partly due to privacy issues of the platforms not tracking users to the level we anticipated. Other issues were simply related to organizational strains for us and partners due to pandemic life and work adjustments. In the future we will work with C*Science organizations early to identify evaluation and data collection capacity at the onset of partnerships. Identifying data needs to happen early in the program planning stage to track and measure impact.
To assess reach and audience interest we analyzed Science Friday C*Science web traffic (see Table 1 below). We wanted to understand how media content structure activates listeners to learn more about online projects. COVID Near You, Crowd the Tap, and Satellite Streak Watcher were story-focused segments, while City Nature Challenge, ISee Change, and Zooniverse were shoutout-style segments.
| C*Science Project | Radio Air Date | Total Page Views | Unique Views | Avg Time on Page | Exit Rate |
| COVID Near You | 3/27/2020 | 33,657 | 28,101 | 5:13 | 76% |
| Crowd the Tap | 4/3/2020 | 4,702 | 4,007 | 2:37 | 53% |
| Isee Change | 4/10/2020 | 682 | 604 | 2:44 | 51% |
| City Nature Challenge | 4/17/2020 | 1,384 | 1,188 | 3:23 | 58% |
| Zooniverse Projects* | 4/24/2020 | 3,350 | 2,660 | 2:15 | 52% |
| Satellite Streak Watcher | 7/10/2020 | 2,999 | 1,565 | 1:21 | 42% |
Table 1. Science Friday C*Science audience reach using Google Analytics. *Includes Planet Four, Bash the Bug, Anti-slavery Manuscript, and University of Wyoming Raccoon Project
Story-focused segments and news hooks (e.g. COVID, Crowd the Tap) appeared more successful in recruiting C*Science volunteers than project-focused segments. This may be because it provides the audience with more context which allows for more buy-in. COVID Near You was the most viewed C*Science project on our site which made sense, given the onset of the pandemic. People were interested in learning more about COVID-19 and may have felt like this was a way to meaningfully contribute. More than six times the number of people viewed this project compared to the next highest project Crowd the Tap (33,657 vs 4,702). They also stayed longer on the page which suggests increased knowledge-seeking (5:13 vs 3:23 for City Nature). However, a short time on a page is not necessarily a bad thing. If it is coupled with a high exit rate, it can signal that they received the necessary information and then left for the C*Science project site (e.g. City Nature Challenge).
We used the exit rate as a proxy measure for conversion to C*Science partner sites. Exit rate is the number of people who exit a website after landing on a company’s page and interact with their website. It can be often used as a metric of a webpage’s conversion rate. Usually conversion rates are intended to be low as organizations want users to engage with the site as much as possible. However, our intention designing the C*Science landing page for our website was to provide audiences with quick but robust information on the projects and actively have them leave quickly to sign up on the partner’s project page. If average exit rate for websites is 26-40%, we would expect the reverse: a rate of 40% or higher signals of conversion to the C*Science partner page.
Exit rate/conversion to C*Science partner sites for all projects were much higher than average and were associated with spikes in arrivals to partner pages. Streak Watch produced an exit rate of 42%, which though high, was still lower than other projects. This may be because this is a “heavy lift” project. It required specific equipment (like a phone camera but settings need to be manually adjusted for optimal pictures, and a tripod is recommended for stability), a time commitment (need to go to a different site to look up when satellites will be in their local area and wait for it to pass) and concerned a topic that appeals to a specific subset of science enthusiasts.
This is different from story-focused segments and newshooks (e.g. 76% exit rate for COVID Near You) appeared to be more successful in recruiting C*Science than shoutout style segments (e.g. 52% exit rate for Zooniverse projects). Using this data helped us address some of the data gaps that C*Science projects had. Using web analytics can provide useful key indicators on the success of messaging for audiences members.
Some organizations were unable to provide us with data on their user tracking at the time of programming. For many partners, we were not able to obtain information on weekly averages for their projects, or struggled to directly attribute traffic spikes to Science Friday specifically. In the future, coordinating with partners on their data sharing practices earlier on in the process will allow us to incorporate baseline measures of comparison and success of our programming. C*Science partners did not plan any other major events during the weeks of our programming to help limit any confounding issues and to help more clearly attribute the classifications to Science Friday given their user tracking constraints.
In order to measure the impact of our programming on C*Science projects, we used the number of classifications or data points received on the day of radio broadcast, the day of the livestream and the number of classifications in the seven days following broadcasts. These data were provided by project organizers and hosting platforms (i.e. Zooniverse and/or Anectedata) (see Figure 1 below). Science Friday audiences made 190,838 classifications for partner projects between the livestream and radio airdates in 2020.
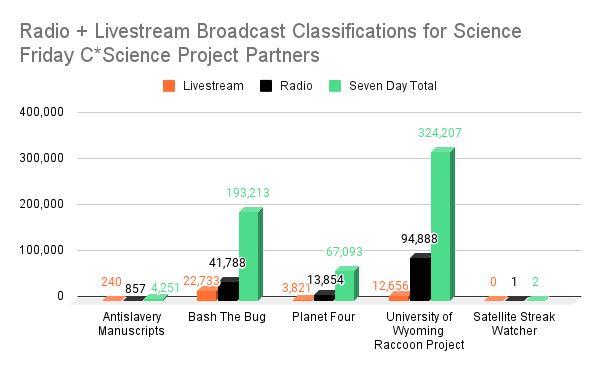
Projects with more approachable nouns in the titles, and possibly, more relevant to audiences’ lives (UW Raccoon Project and Bash the Bug) appear to have lead to more volunteers than projects that are more specialized (Anti-slavery Manuscripts, Planet Four, Satellite Streak Watcher). Across all projects, we saw that there were more classifications on the day of the radio show air date compared to the live stream.
For example, the University of Wyoming’s Raccoon project had 100K+ classifications logged on their site. The nature of the task—watching camera trap videos of cute raccoons solving puzzles—may be an easier lift than other projects that require more dedicated time to review data—like the Antislavery Manuscripts project. We incorporated a game into the Zoom event, called “Raccoon Superlatives” where participants looked at photos to identify raccoon behavior with the aid of presenters. This allowed for engagement of the audience while providing a glimpse of the type of tasks that volunteers may be asked to complete. While playing the game audience members were engaged and interested in learning more:
“I could do raccoon superlatives for life”
“How can I have that kind of project where I live”
In 2020, we launched Citizen Science Month, a month-long C*Science campaign where we launched several projects in partnership with SciStarter. In 2021, we flipped that model on its head, and instead focused on a single project using a story-based approach, and provide experiences related to a single theme: pollinator conservation. Our goal was to convert differentiated but interested audiences to become participants of project The Great Sunflower Project (TGSP). By focusing on a single project, we could investigate various recruitment strategies while controlling biasing factors including submission format, topic interest, and seasonality.
We built our partnership with TGSP on program learnings from a research study we conducted of 390 audience members on barriers to C*science volunteering in Year 1. Beginning in the months of March and April 2021, Science Friday established a storyline and invitation to participate in C*Science with TGSP. Billed as a “Pollinator Palooza,” the offerings ranged widely, beginning with on-air stories about pollinator abundance and distribution, with livestream expert “battles” over different types of pollinators. The livestream event awarded different pollinators with superlatives (including Most Likely To Succeed, Class Clown, Best Costumer) similar to the Raccoon Project from Year 1. The livestream also included brand new activities and models for K-6 learners to explore pollinator adaptations.
Radio producers Kathleen Davis and Alexa Lim launched the Pollinator Palooza on April 2nd, 2021 with an hour-long series of segments about all things pollinator, ending with a call to action to participate in TGSP which converted over 650 listeners to the project web page in the first 24 hours after airing. We aired the following segments in our April 2nd radio launch, and promoted the project on-air on our April 9th, 2021 show.
We compared this single-project program design with the many-project approach of Year 1, using the most effective strategies from prior A/B testing. This “apples to apples” approach helped us ask audiences which style of livestream engagement was most effective independent of project content area, and which modes generated the largest number of participants.
Two live stream events were held during C*Science Month 2021. One was a project-forward event in which our Experiences Manager, Diana Montano, spent more time explaining the project and how to use the platform with attendees listening and watching. This is analogous to a “high-touch” scenario, designed to address one commonly reported barrier of participation, which is project difficulty, and mirrored our 2020 event format. The science forward or “low-touch” event was focused less on explaining platform logistics and project impact, and spent more time sharing information about pollinator science, species, and researchers. The high-touch and low-touch livestream events were held at the same time of day and day of the week to limit biasing effects.
Pollinator Palooza, or the high-touch live Zoom event, on April 19, 2021. The event was hosted by Diana Montano. Erica McAlister (top right), Senior Curator, Diptera at The National History Museum in London, Peter Soroye, Assessment and Outreach Coordinator for the Key Biodiversity Areas Program at Wildlife Conservation Society Canada (bottom left), and Dana Green, PhD candidate at the University of Regina in Saskatchewan, Canada, were guests.
Springtime Showdown, or the low-touch live Zoom event, on April 26, 2021. The event was hosted by Diana Montano. Erica McAlister (top right), Senior Curator, Diptera at The National History Museum in London, Peter Soroye, Assessment and Outreach Coordinator for the Key Biodiversity Areas Program at Wildlife Conservation Society Canada (bottom left), and Dana Green, PhD candidate at the University of Regina in Saskatchewan, Canada, were guests.
| Livestream Treatment | Number Of Live Event Attendees | Facebook Average Watch Time | Number Of Questions Asked | Facebook Positive Reactions | Number Of Facebook Comments |
| Project-Forward/ High-Touch | 65 | 24 minutes | 4 | 66 | 29 |
| Science-Forward/ Low-Touch | 56 | 34 minutes | 8 | 111 | 66 |
Table 2. Science Friday audience engagement on Facebook for high- vs low-touch events.
A similar number of attendees participated in the low-touch, science-forward (56) and high-touch, project-forward event (65). Overall, attendees appeared to be more engaged in the low-touch event than the high-touch across Facebook and Zoom audiences. Average watch time for the project-forward event was 24 minutes compared to 34 minutes for the science-forward event. Attendees asked twice as many questions for the science-forward event (8 vs 4), had more positive reactions to it (111 vs 66), more comments (61 vs 29), and more shares (22 vs 16). When compared to 2020 livestream events (which mirrored the project-forward model), the engagement metrics were similar, however, average watch time was notably higher for both 2021 events (24 and 34 minutes) compared to the longest watch time for 2020 events (16 minutes). This mirrored the same patterns of engagement that we saw framed in our on-air invitations.
We relied on our partner organizations to track arrivals from Science Friday’s site to two target landing pages as proxies for participant recruitment: TGSP’s SciStarter page and TGSP’s home page. Overall, our efforts to promote TGSP generated a significant traffic boost to SciStarter, generating a total of 720 unique visitors directly from Science Friday’s site during the target period March 30-May 8 (tracked by UTM coded linking on Science Friday’s primary landing page).
While this represented significantly less than to Science Friday’s website during this time, it was an 843% increase in participation in TGSP over the same time span compared to the year prior. A rough conversion rate of just over 30% is excellent (720 conversions to SciStarter from 2255 unique viewers to Science Friday’s primary landing page = 31.9% conversion rate) although this does not capture direct conversions from livestreams and radio listeners who google the project after initial contact.
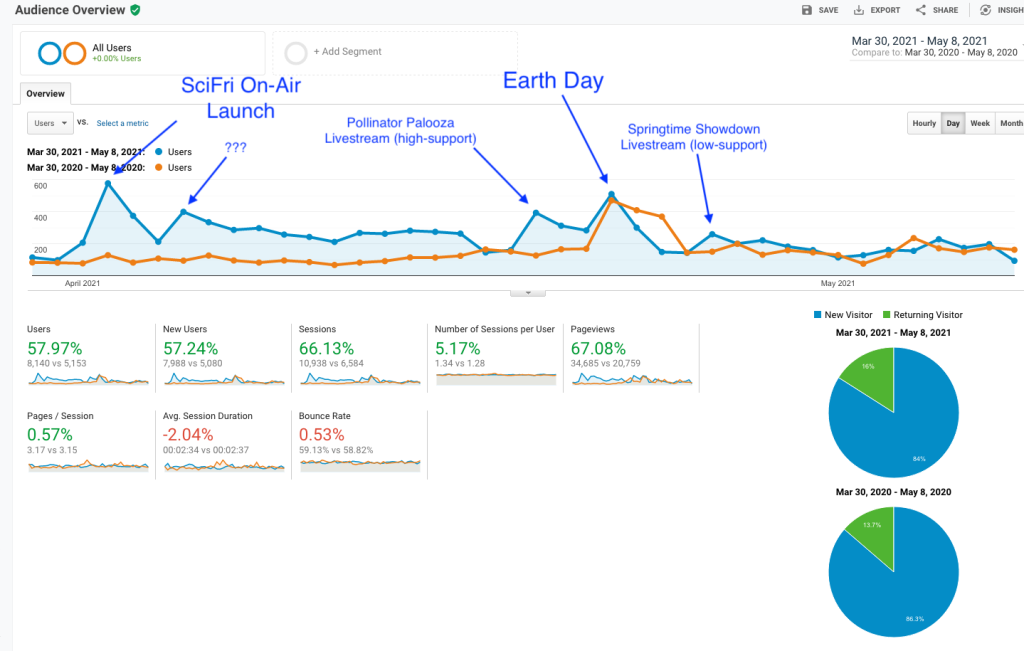
TGSP’s main page from March 30-May 8 during that time was also substantial (over 8,000 unique visitors), and was a 57% increase over the same period the year prior. TGSP provided a day-to-day resolution of arrivals to their site (see Figure 2 above), which allowed us to attribute some outreach efforts to rises in traffic even though referral UTM coding wasn’t possible at the time of our collaboration.
Most notably, besides large increases in traffic around the Science Friday radio segment on April 2nd and on Earth Day on April 22nd, is the clear bump in traffic associated with the high-touch livestream event, and the absence of a boost from the low-touch livestream event. Though multiple measures of engagement showed the low-touch livestream was perhaps more engaging and better attended, it would appear that the high-touch event converted more folks directly to the project (on, and for the two days after it streamed on April 19, 2021).
Due to data tracking constraints we were not able to track engagement in these projects over time. When discussing the data capacities of C*science partners in the future, it may be useful to consider tracking data up to three months after the partnership. This would potentially allow us to identify retention of volunteers, and any applicable metadata for users (e.g. number of classifications, quality of data collected, etc). These can be helpful when adapting future media messaging and program design to respond to issues in real time. The overall recruitment-education-participation pathway that we mapped with TGSP collaboration last spring provides multiple small and large-scale learnings that corroborate our findings from Year 1. We used these to help think about implementation into informal settings for Year 3.
In Year 3 (2022) we wanted to use our media learnings and pivot from general audiences to activation with families, specifically community based organizations (CBO) and informal STEM organizations. Mobile devices and widespread internet access have made it possible for scientists to receive research help from many people, through gathering data from around the country or combing through images with thousands of strangers. Could we learn from best in class C*Science projects and design educational resources with framing informed by learnings from previous years and key stakeholders?
Though it seemed like the perfect opportunity to invite new folks to sit at the science table, distributed C*Science has often recreated many of the identity disparities of the ivory tower. Not surprising, but disappointing. We wanted to know if, and how, distributed (anyone, anywhere) C*Science could be rescued so that it serves diverse communities and supports families raising the next, representative generation of scientists.
Our aim was to recruit experienced family-facing facilitators in a working group to reimagine C*science education resources and implementation. The initial program was designed for five weekly meetings online with one debrief. Each meeting would be 60-90 minutes long, with additional 60 minutes of pre/post meeting work. At the end of the working group we asked organizations to commit to Implementation of 5-10 hrs of a revised activity. Organizations would be committed to about <25 hours total time and compensated $3750 (>$150/hr). Recruitment of program participants for the evaluation included a $50 e-gift card/family. Recruitment for program and initial work was planned for Fall/Winter 2021, with implementation of educational resources and evaluation pilot in Spring 2022.
Our intention was to create a team-authored white paper of recommendations and best practices for the C*Science community, a set of five family-friendly crowd science implementation guides, and an implementation summary of what works and what doesn’t.

Recruitment for STEM-focused organizations began in the Fall of 2021. It was the second full academic school year since the the pandemic started. Educators, CBOs, and STEM based orgs were responding to shifting COVID safety guidelines, incorporating more hybrid learning, and adapting them on the school and district levels.
We aimed to recruit ten CBOs or STEM organizations to be part of the working group. To increase representation of new volunteers we focused on organizations serving historically underrepresented groups in STEM and geographically rural areas. Though many organizations indicated interest in the email phase, it was difficult finding time with them to discuss the working group. For those who did meet with us, the initial interest was high and appreciated the financial compensation for their staff who would be working on the working group.
Additionally, some organizations wanted to know if the programming improved STEM-related self-efficacy with their students and facilitators. However, organizations faced challenges with being able to commit their staff to non-essential programming, particularly as they encountered new and emerging issues of attendance, engagement, recruitment, and retention of program participants in the communities they served. Though they thought having informal facilitators provide feedback was important, it did not outweigh their needs to have ready-to-use resources now, as well as financial support for the necessary materials.
Along with CBOs and informal STEM organizations, Science Friday was experiencing capacity issues as well. We had a gap in staffing due to an open education manager position, were restructuring our organization to be more audience-centered, and shifted to a new fiscal year. Part of our restructure involved rethinking about our strategic vision and impact goals for the upcoming year. We had to make some difficult decisions about our CBO working group.
Ultimately we made the tough decision to halt the pilot. If we truly wanted to be audience-centered, we had to listen to what both internal and external stakeholders were telling us: They need ready-to-use programming that required little on their end. Unfortunately, we simply didn’t have the staff bandwidth to provide meaningful programming at the time. In the remainder of the year, we will shift our approach to a larger family education focus. We may conduct virtual camps to do C*Science, or working with our editorial team to identify future story segments topics that can also amplify C*Science projects.
Early in the 2020 programming we created an evaluation plan that allowed for experimentation through A/B testing. The iterative nature allowed us to respond to the needs of different audiences and identify editorial elements that motivate science activation. We found that story driven programming with an opportunity to do C*Science was more conducive to volunteering compared to short project-promotions radio segments. Live stream audience recruitment and high-touch project programming appeared to activate more volunteering compared to low-touch science forward projects.
These learnings enabled us to move towards unified goals, understand opportunities for partnership, and identify gaps in how we measure and track progress towards goals. One key learning was that not all data tracking is created equal. Much of our measuring success was based on the data availability of partners and their mechanisms for tracking referrals. When doing programming, STEM facilitators and content creators should work with C*Science projects early on to identify what data is available for sharing. Understanding whether our media helped C*Science projects are important for us and the projects to assess whether partnerships are successful, require further exploration, or if resources should be used for other strategies that have been more effective.
Activating new nonprofessional scientists required using a multi-pronged approach to recruitment. For Science Friday, we chose to closely tie in our editorial and educational processes to design programming that amplifies projects to science-interested audiences. To test our media for experimentation purposes, audience and editorial teams had to be clear on what the approach to different segments were and what the “ask” was each time. Messaging and story framing for general audiences, time-specific topics (e.g. COVID, climate change, cancer research) should not be treated the same as specific interest topics (e.g. satellite watching) that may be a heavier lift than those that require specific equipment or being in specific locations (e.g. shark watching). What is the pathway to show the value add of this segment and project to the audience? Creating this audience centric design allows content creators and C*Science projects a roadmap of unified program goals and mileposts to show the impact of the media. This can help identify gaps in audiences served, structure educational resources for stakeholders, and amplify C*Science partners.
As we continue to think about future programming, it is important to take a temperature check with key stakeholders. When linking with partners at the family and community level, C*Science projects and media organizations should consider practical implementation of activities. Ready to use educational resources that require low lifts from families and STEM facilitators should be developed. Family education STEM activation opportunities should consider including experiences that are designed for audiences based on the balance of project tasks (visual, auditory, etc) and medium (live Zoom, radio, social media). If C*Science projects are interested in serving K-12 STEM classroom settings, they may also want to consider aligning them to Next Generation Science Standards to make them plug-and-play. Identifying motivations for C*Science volunteering and aligning back to larger organizational goals gives us direct mechanisms to measure media and partnership impacts. Iterative design allowed us to respond to the changing needs of our organization and partners. Planning for experimentation in the form of A/B testing provided us with an intentional space to consider how lasting change can work in our audiences.
Nahima Ahmed was Science Friday’s Manager of Impact Strategy. She is a researcher who loves to cook curry, discuss identity, and helped the team understand how stories can shape audiences’ access to and interest in science.