Grade Level
All
minutes
1-2 days
subject
Life Science
Activity Type:
animal adaptations, STEAM, Family activity, After School Activity
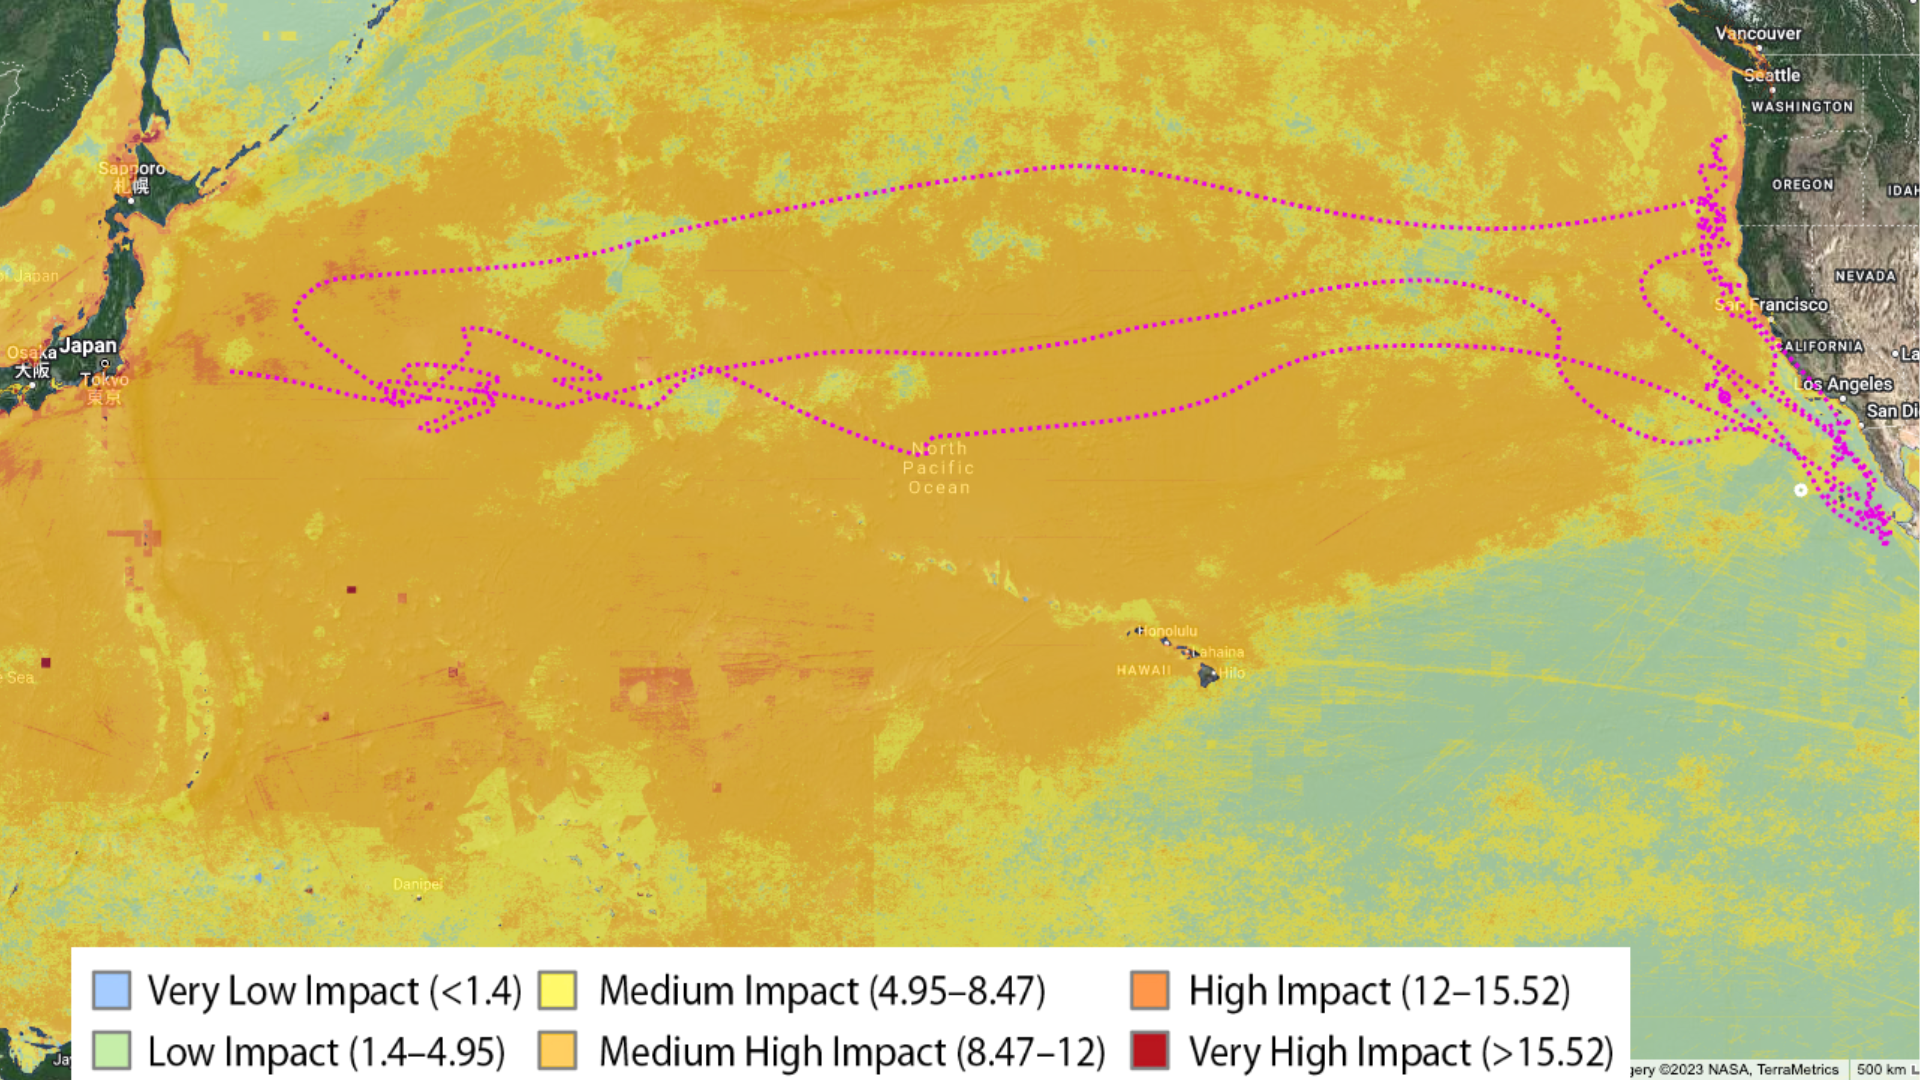
 Take a look at the map below. There is a colored line that shows the movement of one bluefin tuna in the ocean. What do you observe as you look at the map? What does this map tell you about the behavior of this bluefin tuna?
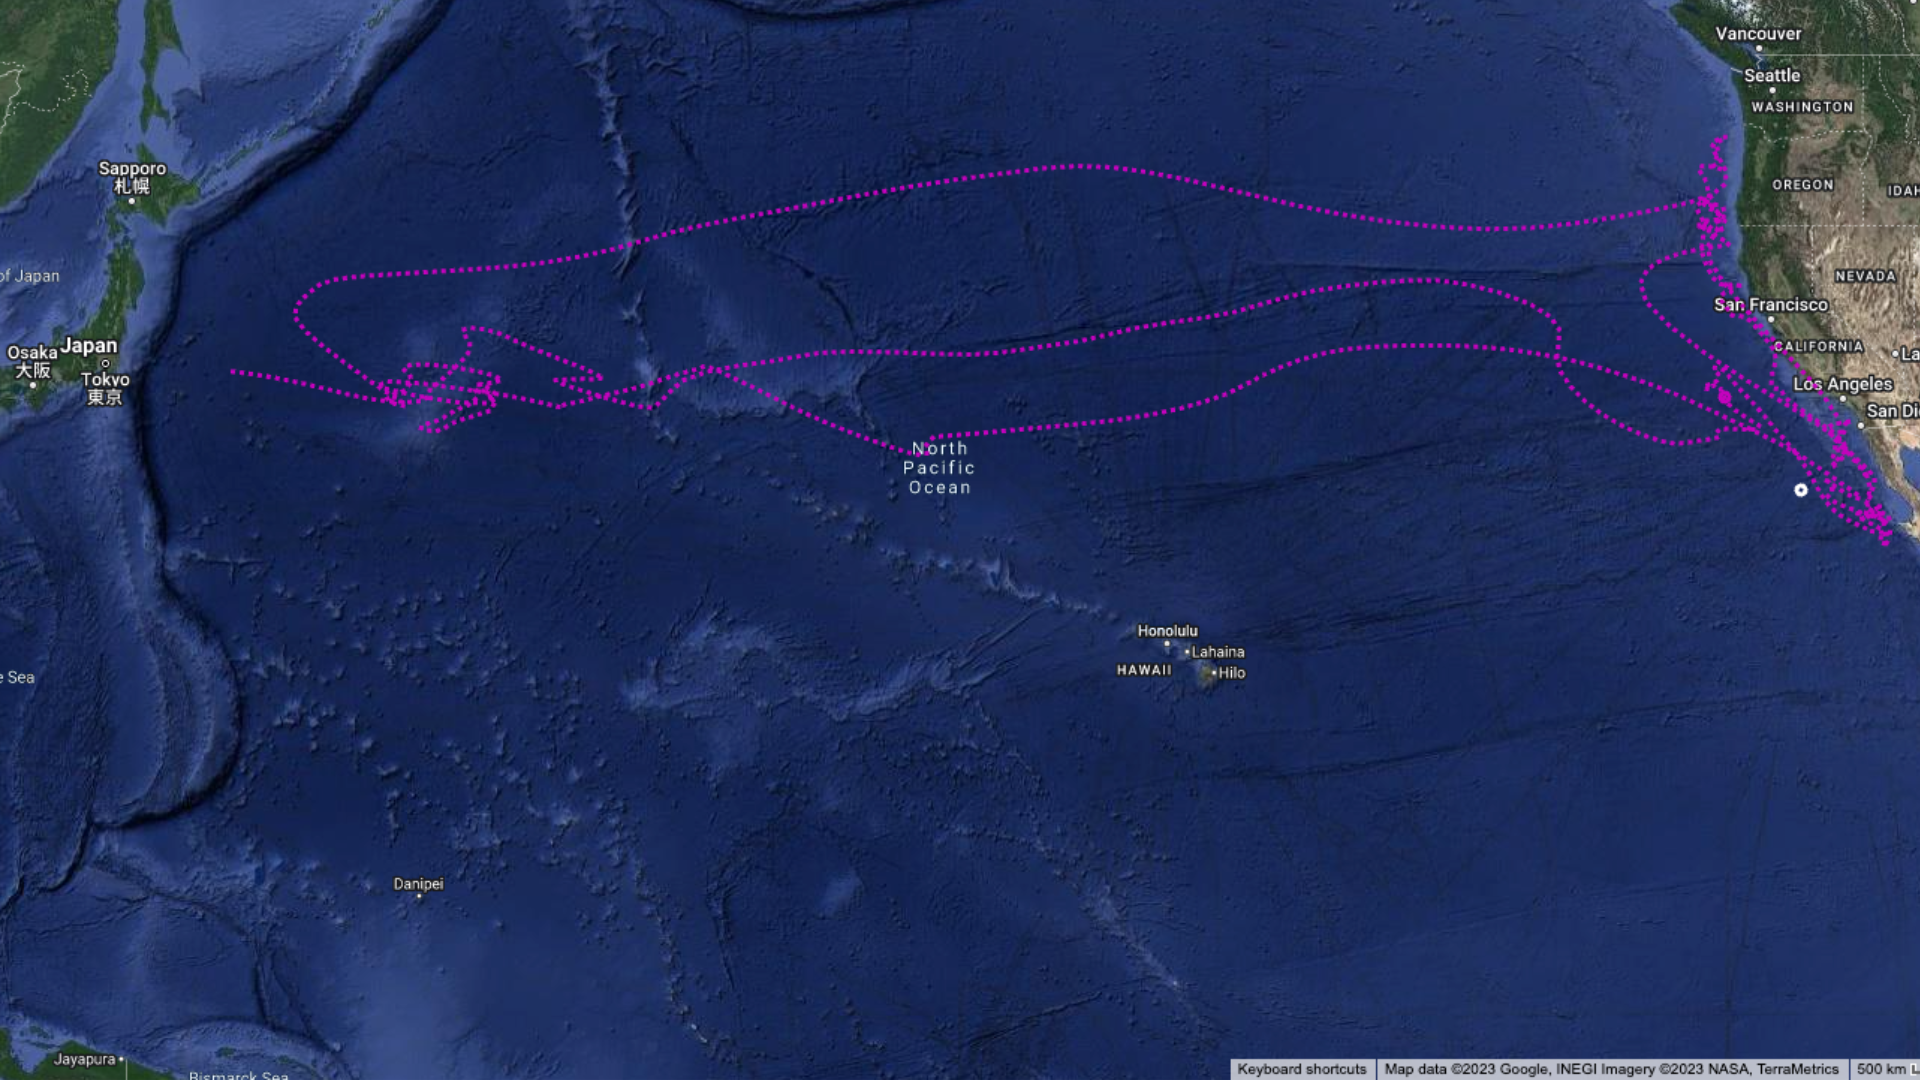
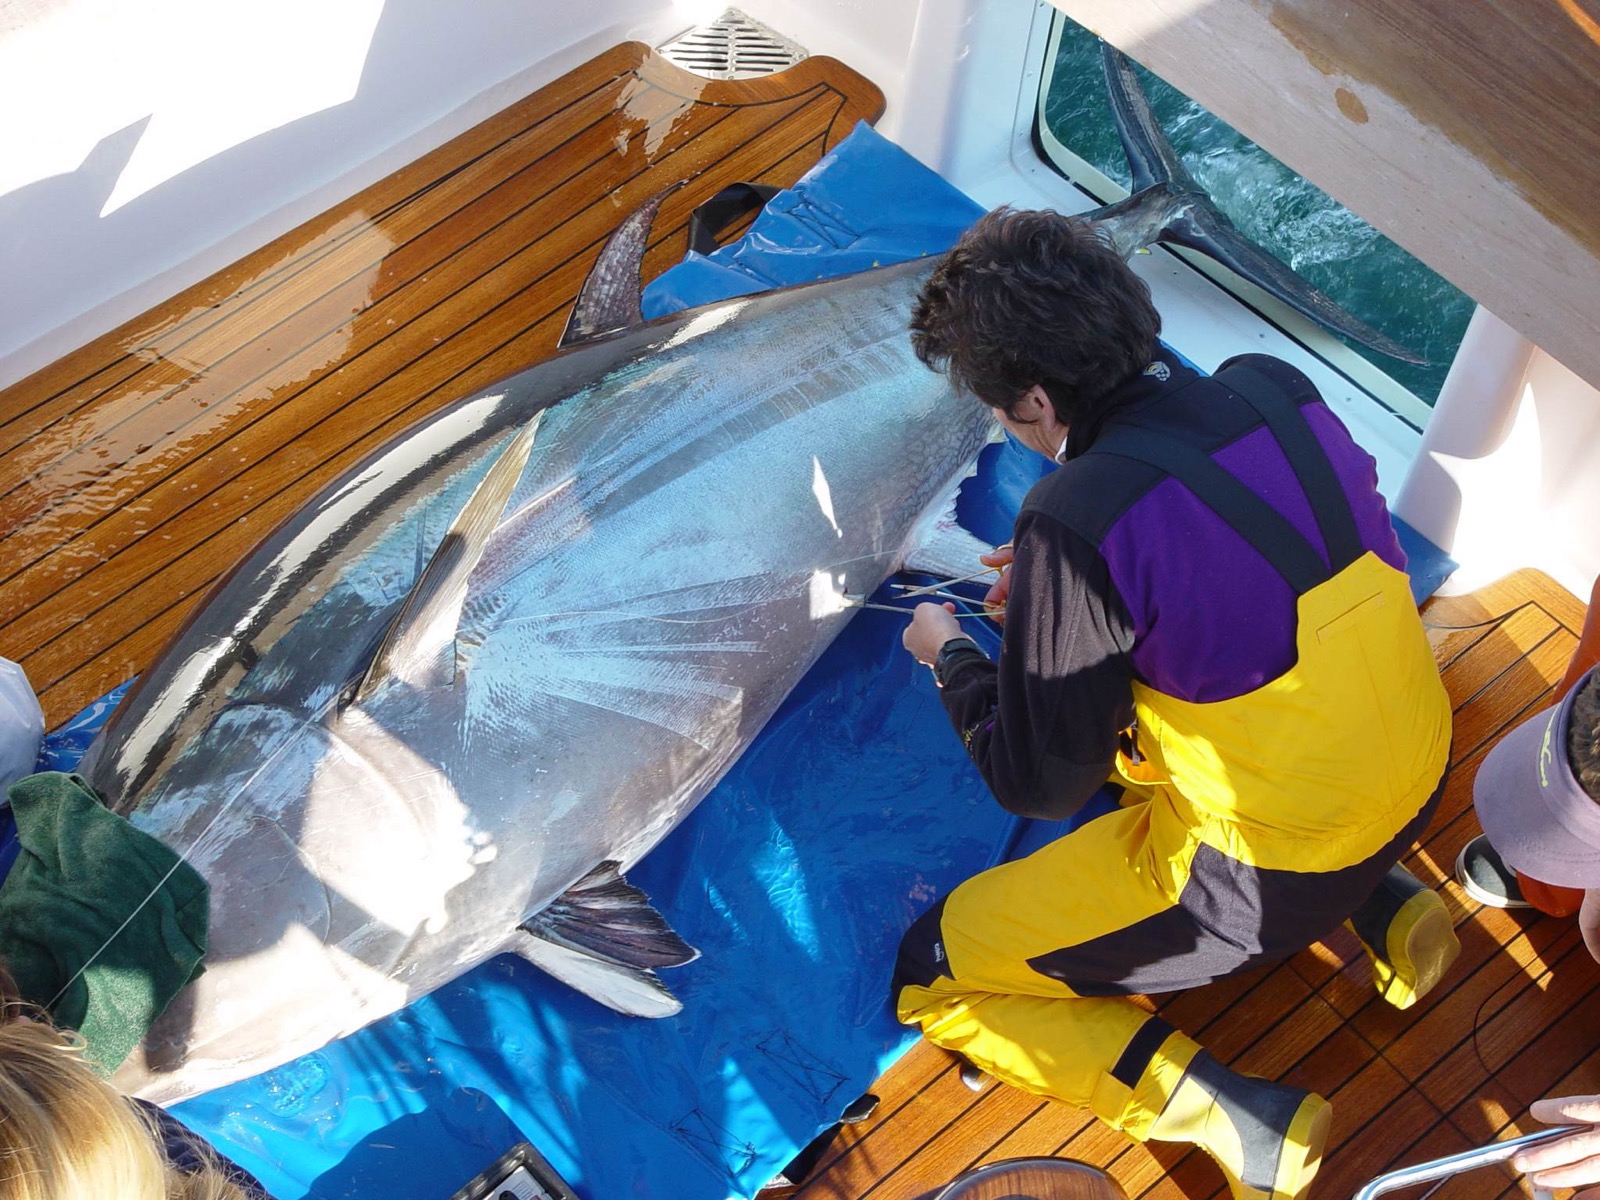
This map was made when researchers attached electronic tags with sensors to the tuna. Satellites monitored their locations from space. The location data is mapped so scientists can see where the tuna travels over time. That purple line represents the journey of Bluefin Tuna #66048 over the course of two years. Scientists track dozens of tuna every year. Sound fishy? It’s not. It’s really important science!
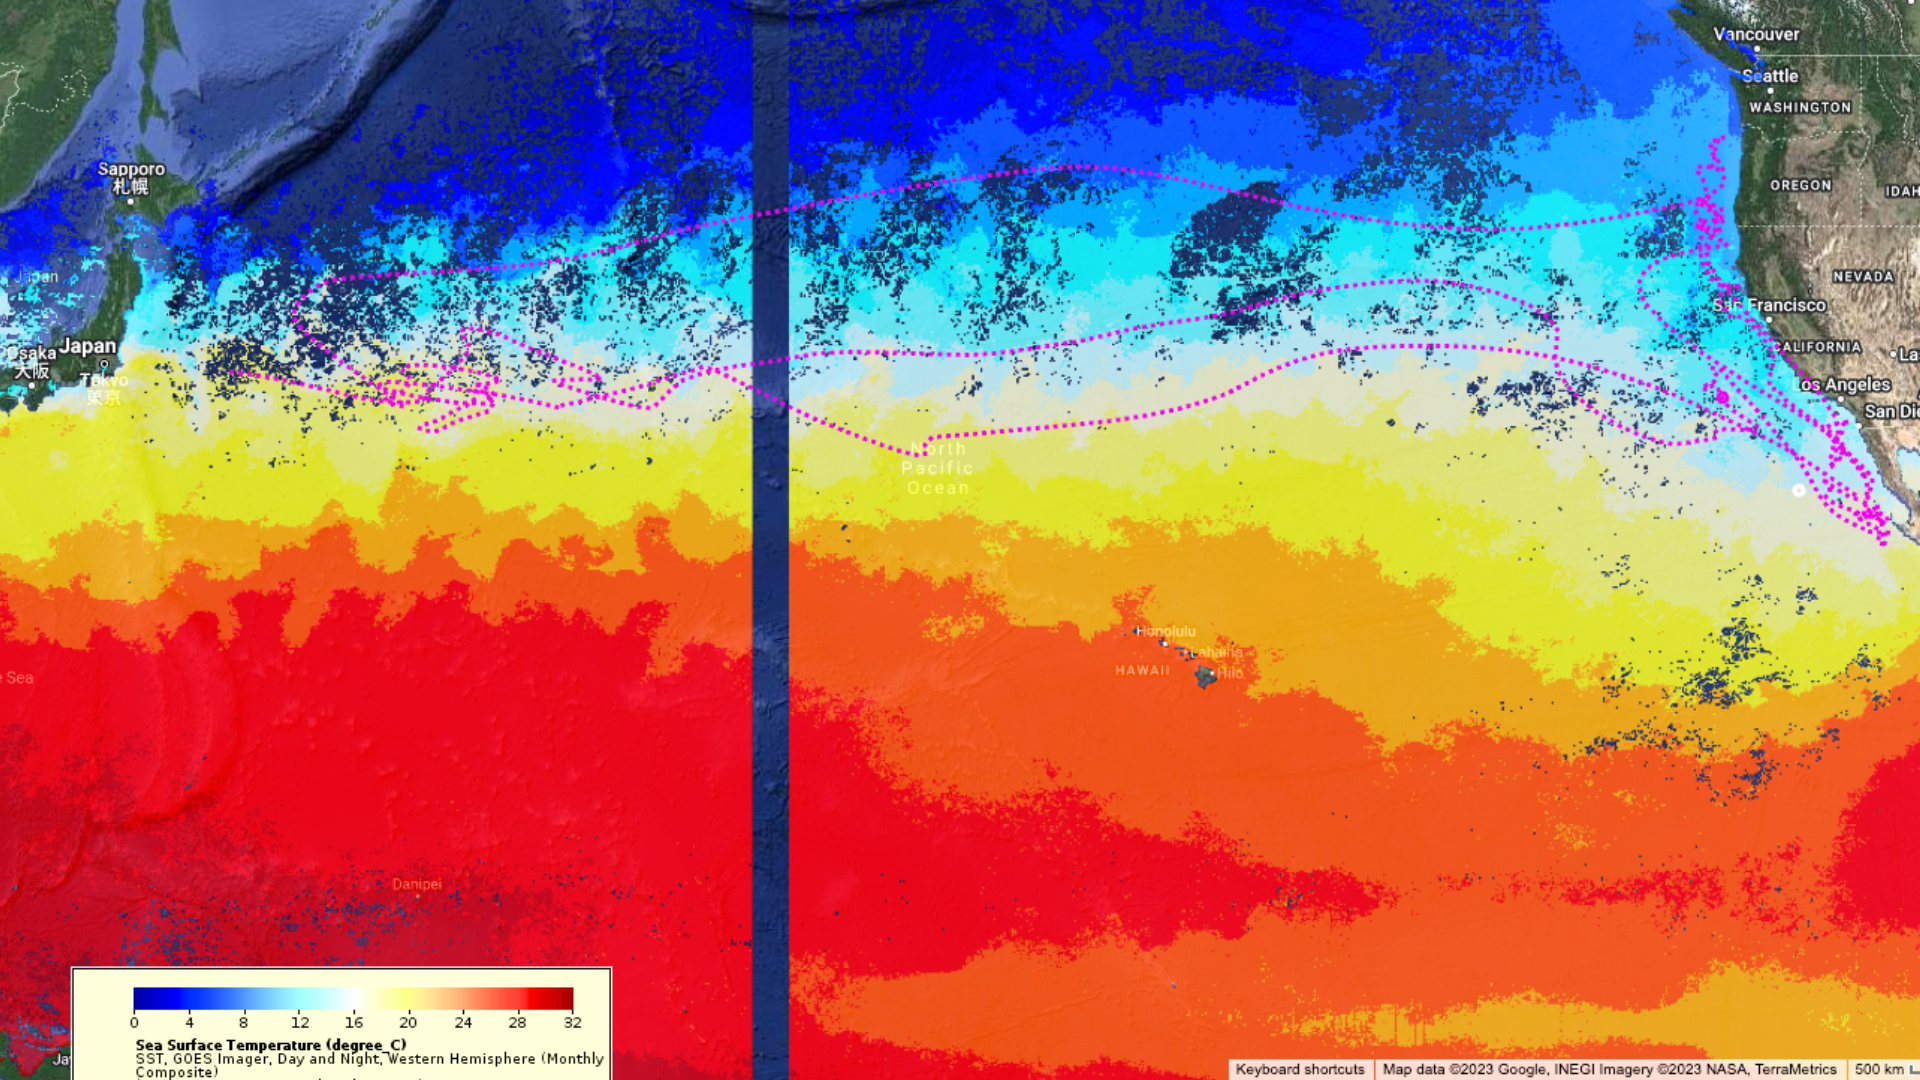
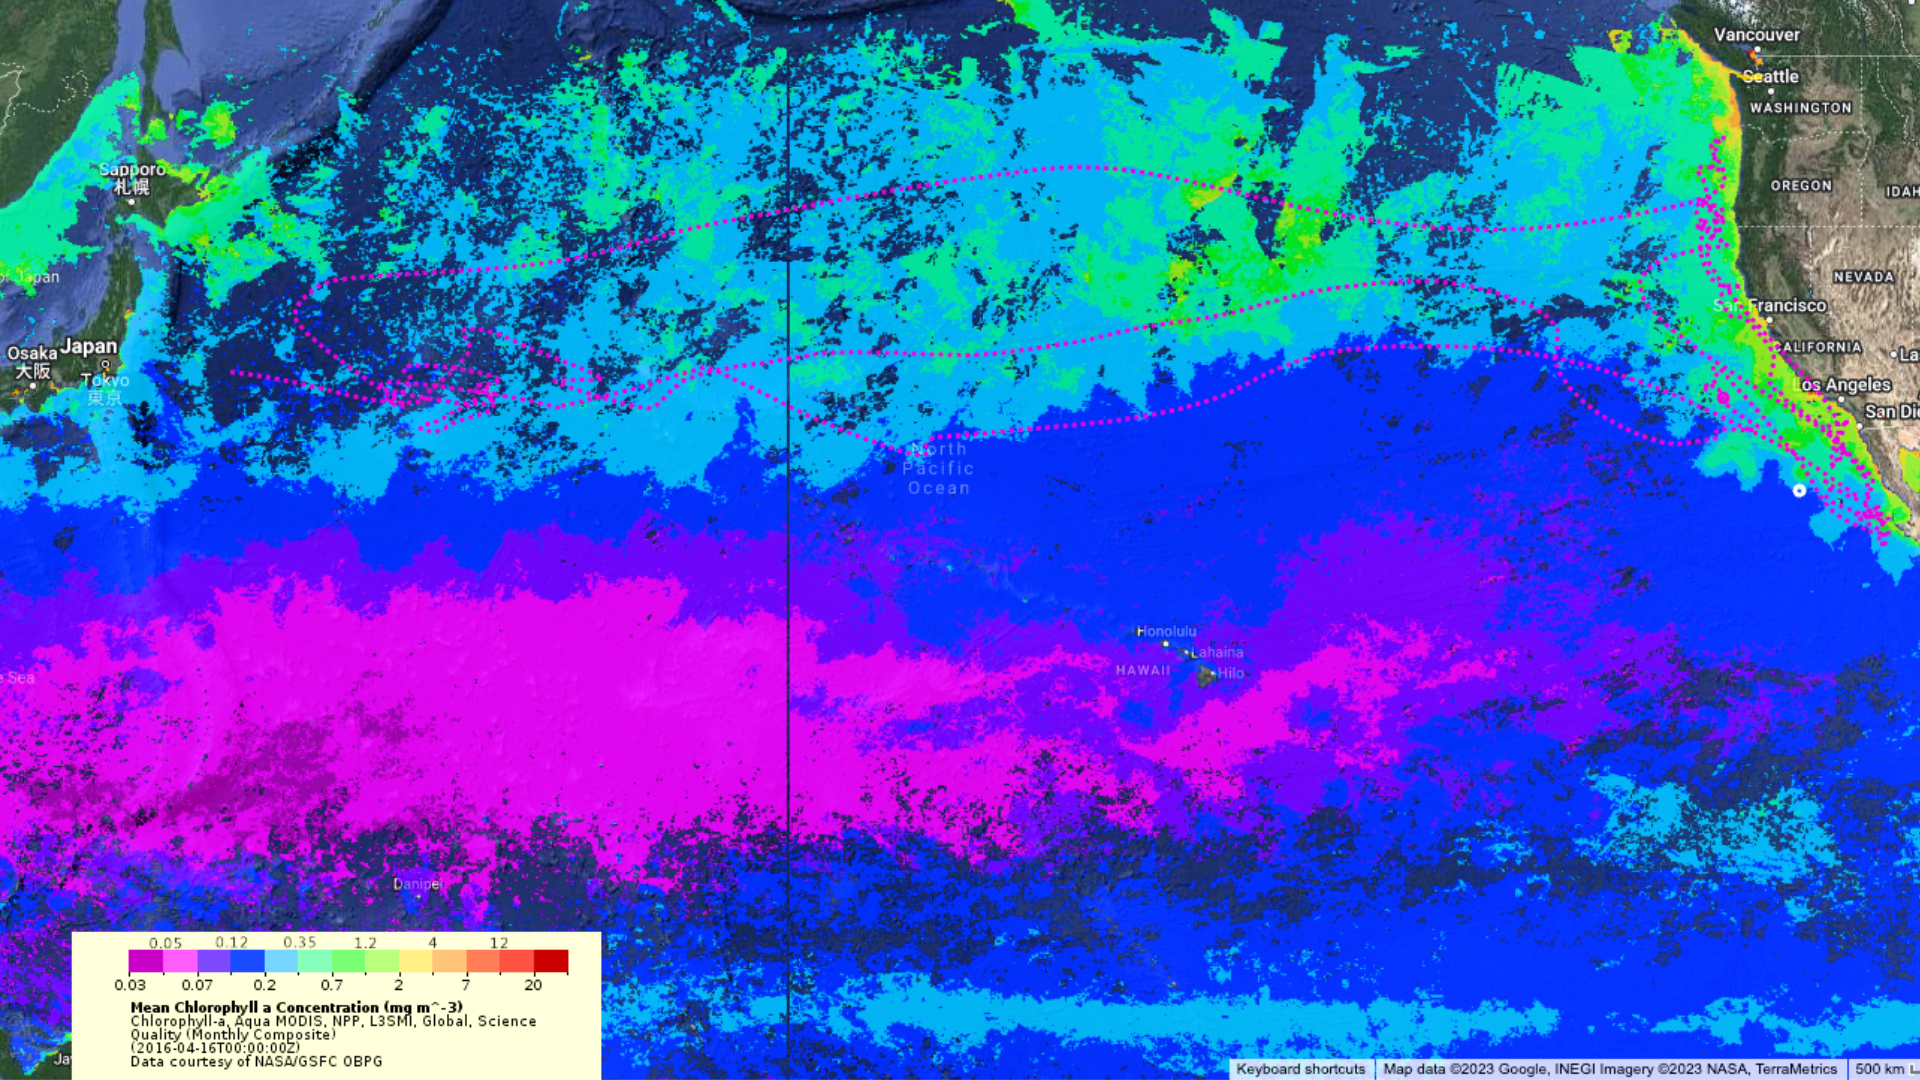
Putting Together The Whole Picture
When researchers pair tuna location data with information about the fish’s environment, you start to understand their behavior more clearly. Below are three more maps of the same tuna swimming path. One shows the water temperatures in various parts of the ocean. The second shows primary productivity—the amount of chlorophyll in the surface waters indicates the amount of algae there. The last map shows human impacts like pollution, shipping, and fishing. Looking at these three maps, what patterns do you notice? What patterns in the swimming path and maps suggest that the tuna’s path is influenced by its environment?
When science journalist Karen Pinchin stopped by Science Friday, she shared how important tracking bluefin tuna has been to understanding their behavior. A better understanding of how these fish move through the oceans and where they breed has led to changes in international fishing policy. Now, after years of steep decline, the bluefin tuna population is on the rise.
“[O]ver decades of dedicated tagging and tracking these fish from the air and watching catch landings and analyzing the otoliths, the tiny little ear bones, scientists are starting to understand… We needed systems that said, where are these fish? How many of them are we catching?” – Karen Pinchin
A Tuna’s Reel Life Adventures
Try Tracking Your Movements
Do you think your environment might affect your behavior?
You don’t have to be a scientist with fancy equipment to map an animal’s movements. All you need is a notebook, a pencil, and a clock. You’re going to track the movement of a very interesting mammal carefully—you!
Here’s what to do.
- Start your data log when you wake up. Write down the time and where you are. For example, “8:00 am, bedroom.”
- Every hour add your location at that time to your log.**
- Continue collecting data until bedtime.
- The next day, draw a simple map of your house (or school or town). It doesn’t have to be perfect or to scale. Label each room.
- On your map, make a dot for each place you logged in your notebook. Write the time over the dot or number the dots in order.
- Now comes the fun part! Draw a line that tracks your movement from the first dot to the next and next, and so on, until you have traced your entire day of movements on your map.
** If you want a tougher challenge, add the time and place to your log every single time you move to a new room.
Take a look at your map.
- What do you notice about where and how you move around you home?
- Are there any trends in your behavior?
- How can you use this information to improve your life and your environment?
Have friends or family map their movements, too. How are your movements like those of others? How are they different?
There Once Was A Fish Named Amelia
First tagged in 2004, one Atlantic bluefin tuna was nicknamed Amelia, after Amelia Earhart, the first woman to fly alone across the Atlantic Ocean. That’s because Amelia (the fish) crossed the ocean as well. Over the course of 14 years, Amelia challenged what scientists thought they knew about her species.
At the time, many scientists and policymakers thought bluefin tuna mostly stayed near their coastal spawning areas. That assumption formed the basis of international treaties about fishing tuna, but Amelia showed that assumption was incorrect. Soon more and more data was collected about other tuna doing the same thing.
Eventually, the laws around fishing bluefin tuna changed. The information collected by scientists using electronic tags sending tracking data into space gave conservationists the evidence they needed to argue for lowering the number of bluefin tuna that could be caught for food. As a result, a fish species that was endangered is now making a comeback.
Bluefin tuna isn’t the only species that scientists are watching. For example, using the interactive maps on the Global Tagging of Pelagic Predators Program (GTOPP) website, you can explore international efforts to track sharks, seals, turtles, seabirds, and fish. It’s hoped that by combining data about many animals, scientists will gain deeper insights into how ocean ecosystems work and a greater understanding of planet Earth.
What animals would you track if you could? What would you want to learn?
Want To Learn More?
- Try Ocean Tracks, an interface for learners and educators that uses GTOPP data to teach oceanography.
- Use the GPS on a smartphone or smartwatch to track a car trip or walk.
- Listen to the entire interview with Karen Pinchin, A Tuna’s Reel Life Adventures.
- Read a book excerpt from Pinchin’s book, Bluefin Tuna Help Tell The Story Of Our Oceans.
- Read Kings of Their Own Ocean: Tuna, Obsession, and the Future of Our Seas.
Credits
Lesson by Sandy Roberts
Copyediting by Ariel Zych
Digital Production by Sandy Roberts
Meet the Writer
About Sandy Roberts
Sandy Roberts is Science Friday’s Education Program Manager, where she creates learning resources and experiences to advance STEM equity in all learning environments. Lately, she’s been playing with origami circuits and trying to perfect a gluten-free sourdough recipe.