The Colorado River Misses Its Snow
6:53 minutes

This segment is part of The State of Science, a series featuring science stories from public radio stations across the United States. This story, by Alex Hager, originally appeared on KUNC, an NPR station in Northern Colorado.
High in the Rocky Mountains, under thin air and bluebird skies, the Colorado River basin is slowly filling its savings account. Craggy peaks become smooth walls of white and piles of snow climb conifer trunks, covering even the deepest, darkest corners of the woods with a glimmering blanket.
The snow that accumulates in the mountains of Colorado and Wyoming will eventually become water in the Colorado River. Some of it will flow as far south as Mexico, running through kitchen faucets in cities and suburbs along the way, or watering crops that keep America fed through the winter.
Year by year, those piles are getting slightly smaller and melting earlier — slowly exhibiting the sting of a warming climate. The way we measure the snow is changing too, as a shifting baseline for what counts as “average” paints a somewhat deceptive picture of how much snow is stored up in the mountains.
It’s the type of thing that plays out subtly over the course of a human lifetime. On ski mountains across the region, it might be hard to notice anything beyond the normal ebb and flow of good years and bad years.
Tony Vagneur, a born-and-raised Aspen local, is looking out across the slopes of the town’s main ski mountain, basking in the warm afternoon sun and the glory of a classic Colorado ski day.
“Blue sky, bluebird day,” he said. “The kind everybody talks about. Temperatures probably in the low teens. The snow is hard and fast. I mean, it’s perfect.”

This mountain and the town at its base depend on snow to keep the resort running. Vagneur has been skiing it for more than 70 years, and hasn’t noticed much change as far as the snow is concerned. But down in the valley, where he lives on a ranch, signs of changing snowpack are manifesting, starting with a dry year in the mid-70s that left his fields snowless by March.
“I hate to say, but many Marches after that, the hay fields have been bare,” he said. “So anecdotally, you could say it is probably a little less snow. Or maybe it’s warmer. I don’t know, not being a scientist. But it’s noticeable.”
It’s noticeable to the scientists too, who have data to back up observations that Colorado’s snowpack is changing.
“If you look at long-term climate trends, you see a general warming in climate,” said Heather Lewin, science and policy director at Roaring Fork Conservancy. “Which doesn’t necessarily change the amount of precipitation in headwaters areas, but changes how it falls.”
The conservancy does river research and education just downstream of Aspen, where snowmelt rushes through the valley on its way to the Colorado River. The Roaring Fork watershed makes up 0.5% of the landmass in the Colorado River basin, but provides about 10% of its water.
“We’re seeing more precipitation as rain rather than as snow,” Lewin said. “So that means instead of having a savings account, we have a spending account that hits the river and moves quickly, versus a savings account that kind of gives us a long-term security.”

As snow behavior changes, so does the way we understand snow measurement. In spring 2021, the National Oceanic and Atmospheric Administration (NOAA) shifted how it calculates averages for all of its data.
In a way, it’s routine. Every 10 years, NOAA moves the three-decade window that it uses for averages. But the rapidly accelerating effects of climate change mean the current window sticks out from previous 30-year periods. The current window runs from 1991 to 2020, which includes the hottest-ever period in America’s recorded weather history.
Because of that, snowpack data tells a slightly deceptive story. It’s most frequently shared as a percent of average when it appears in newspapers and reports for skiers and river users. For example, if snowpack is at 120%, the number would appear far lower if current totals were compared to normals going back further than 30 years.

“The context right now is that 120% of average might give us an inflated sense of confidence as to how much water we’re going to see this summer and how much snow we’re really looking at right now,” Lewin said.
Other scientists are noting some change too, including those who actually gather the snow measurements.
“When I first started 15 years ago, we’d actually measure some snow in the April-May survey,” said Stephen Jaouen, a conservationist with the Natural Resources Conservation Service. “And a lot of times now, we just walk in and there’s no snow.”
Jaouen conducts snow surveys deep in the Roaring Fork watershed, where getting good data requires a bit of trekking. After a drive downstream from Aspen, the winding mountain road extends past the fringes of cell signal, past a sprawling reservoir and up through dense thickets of Aspen trees.
At a trailhead on the side of the road, Jaouen and a technician click into backcountry skis and begin the journey downhill – a stumbly start-and-stop bushwhack through low brush and scattered tree trunks.
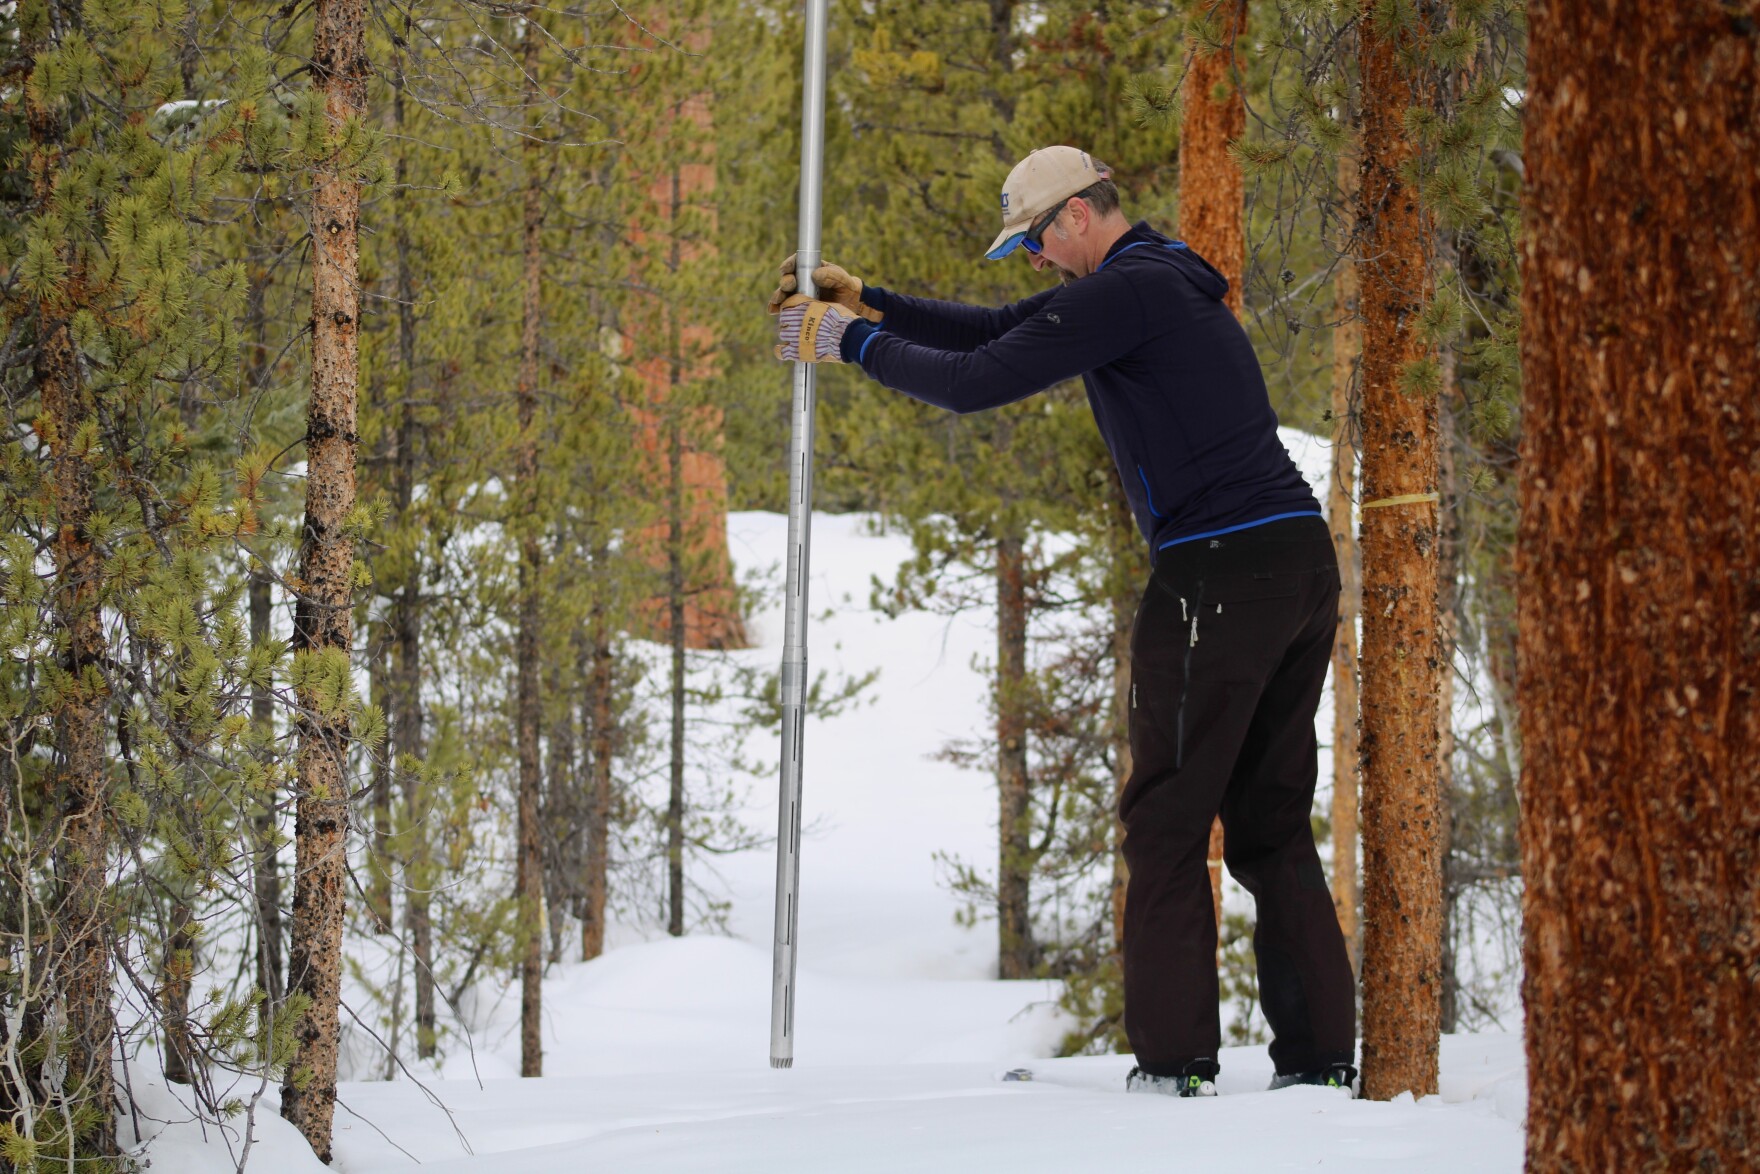
Then, with the help of traction skins on the bottoms of their skis, the pair hikes even further into the woods, following the route from memory until they reach the snow survey site. Here, Jaouen assembles a long aluminum tube and pulls out an analog scale. At nine separate points, he plunges the tube into the snow underfoot, filling it with a core of the white stuff. Using a ruler on the tube and the handheld scale, Jaouen and the technician produce measurements and jot down findings in a little notebook.

The process may sound a bit old-school, and that’s because it is. This exact site has been used for snow measurement — conducted in the exact same way — for almost a century. The only thing that’s changed, Jaouen said, is that heavy steel tubes were swapped for aluminum for easier carrying.
“You just know that the data has been collected the same way for so long that we can see rises and falls in snow water equivalent,” he said. “You know what different years were happening all the way back into the ’30s.”
The old-fashioned techniques were joined by a high-tech network of SNOTEL measuring sites in the 1970s and ‘80s, adding greater depth to the West’s understanding of snowpack. They use sensitive measuring equipment and automatically beam data to researchers via satellite.
Together, the new and old data paint an increasingly important picture of the region’s water supply.
“I think as the West got developed and more and more people showed up and are using the river, it becomes that much more important that people understand it and know that this water one day is going to feed California avocados or Mexico cantaloupe,” Jaouen said.

While drought has dominated headlines during many recent Colorado summers, Lewin and others say the fate of the Colorado River is determined in the winter. While other factors like soil moisture and temperature play an important role in water availability and the likelihood of wildfire, snow is a key metric for understanding how dry summers will be.
As the ongoing drought pushes water issues more prominently into the public eye, she says it’s important to make sure the public fully understands data about snow and rivers.
“You need to look at the context that you’re reading or listening to it in because often there’s a bigger picture,” Lewin said. “The data all tells a story, and it just depends on the context that we’re reading it in.”
Invest in quality science journalism by making a donation to Science Friday.
Alex Hager is KUNC’s Water in the West reporter and is based in Fort Collins, Colorado.
IRA FLATOW: This is Science Friday. I’m Ira Flatow. And now it’s time to check in on the state of science.
RADIO BROADCAST: This is KER–
RADIO BROADCAST: For WWNO–
RADIO BROADCAST: St. Louis Public Radio.
RADIO BROADCAST: Iowa Public Radio News.
IRA FLATOW: Local science stories of national significance.
High in the Rocky Mountains, snow stays piled up long into the spring. And the amount of snow matters a lot for the Colorado River. That river is a lifeline for more than 40 million people across the Southwest. And about 70% of the water in it starts as snow. How that snow behaves, how we measure it, are important factors to the people who depend on it.
Joining me today to talk about the importance of the snow pack is Alex Hager, Water in the West reporter for Public Radio Station KUNC, based in Fort Collins, Colorado.
Welcome back to Science Friday.
ALEX HAGER: Thanks for having me back. It’s great to be here.
IRA FLATOW: Nice to have you. OK, let’s get right into this. When you reported this story, you went on an adventure up into the mountains to tag along on a snow survey. What is a snow survey? And why does it matter?
ALEX HAGER: Yeah, a snow survey is an old school way of finding out how much snow is on the ground. But it is still in practice today. So I went on one with some researchers in Colorado. It is quite a trek. First, you’ve got to drive way out of cell range, up into the mountains. Then we strapped on some back country skis, to get a little deeper into the woods. You’re kind of huffing and puffing uphill through the trees.
Then we get to the snow survey site. They pull out this long aluminum tube and they plunge it into the snow underfoot. So now you’ve got this core of snow. And then you can weigh it and measure it. And then an average of those numbers from a few different spots throughout the woods gives you data.
So scientists have had a big high-tech network of electronic sensors that have been measuring snow since the 1970s. But they’ve also been building a huge base of data by doing these manual snow surveys the exact same way since pretty much the time of the Great Depression. And they’ve been doing it in the exact same places. That is really useful, because we’re able to spot long-term trends in this hugely important source of water for the Western US. Because this water from the snow is flowing a long way away from the mountains.
This is Stephen Jaouen, with the Natural Resources Conservation Service. He was the guy conducting that snow survey.
STEPHEN JAOUEN: I think, as the West got developed and more and more people showed up and they’re using the river, it becomes that much more important as people understand it and know that this water one day is going to feed California avocados or Mexico cantaloupe, or whatever, down in that area.
ALEX HAGER: And it’s kind of a crazy thought, when you’re deep in the Rocky Mountains, standing on the snow, but we wouldn’t have water to grow fresh vegetables in the winter if it weren’t for high-altitude snow pack.
IRA FLATOW: And so what is the snow data telling us about how much water will end up in the Colorado River?
ALEX HAGER: Well, right now, snow pack in most of Colorado is a little below average, but close to it. In other parts of the Colorado River Basin, it’s a little lower than that. So Wyoming and Utah, a lot of their mountain ranges are only 70%-80% of normal.
But this part of the country is in year 23 of drought. So it is not exactly a shock that things are on the drier side. And back to back dry years mean that even less water makes it to the river, because the soil is so dry it acts like a sponge and it soaks up some of that runoff. Basically, this area is in desperate need of some better than average snow seasons, and lately it’s been getting the opposite.
IRA FLATOW: So what you’re telling me now, that the data shows that we have less snow now than before.
ALEX HAGER: Yes. In the vast majority of the Mountain West, we are seeing declines in the amount of snow that falls each winter. That is compared with data going back about seven decades. So climate change, making things drier for sure, but it is also, of course, making things warmer. So it’s not just less precipitation but also different precipitation.
I learned a little more about this from Heather Lewin. She is the Science and Policy Director at Roaring Fork Conservancy. That’s a river nonprofit just downstream of the snow survey.
HEATHER LEWIN: So we’re seeing more precipitation as rain rather than as snow. So that means, instead of having a savings account, we have a spending account that hits the river and moves quickly, versus a savings account that kind of gives us a long-term security.
ALEX HAGER: And this is at a time when people are really looking to make withdrawals from that savings account. The nation’s largest reservoirs are shrinking. There is less snow melt to refill them. And at the same time, you’ve got homes and businesses, from Denver to Phoenix, to Vegas to San Diego, and everywhere in between, depending on that water.
IRA FLATOW: Yeah, I understand that now. In your reporting, you mentioned that there was recently a change in the way we understand snow measurements. Tell us more about that, please.
ALEX HAGER: Yeah. So this is really interesting. So NOAA, the National Oceanic and Atmospheric Administration, every 10 years, they shift the window we use to calculate averages for all of their weather data, whether that’s rain or temperature or, of course, snow pack. So last year, new data was being compared against numbers from 1981 to 2010.
Now, the new three-decade window goes from 1991 to 2020. And the past 10 years have been the hottest in the history of America’s recorded weather. So when you see this April snow data is like 94% of average, that same amount of snow would have showed up as a smaller number the year before. And that’s deceptive. The snow pack data, it’s a little bit of wonky stuff, but people see it. These averages are regular reading for skiers and river rafters.
And in some of the mountain towns near where that snow falls, data like that is printed in the newspaper. And without proper context, people might lose sight of the way that climate change is really reshaping the world around us.
IRA FLATOW: Yeah, for some people, it’s just, do I go skiing this weekend? For other people, it’s whether– it’s survival, drinking water. Yeah. Where else do measurement changes show up in climate data?
ALEX HAGER: Yeah. They show up everywhere. NOAA is one of the top weather offices in the land. So whether you are somewhere with a lot of rain and snow, not enough rain and snow, really cold lows, really hot highs, if you see any of those numbers displayed as a percentage of average, you’re seeing an average now that only goes back into the early 1990s, and you are not seeing the sweeping long-term changes that climate change is bringing to every corner of this country.
Again, Heather Lewin.
HEATHER LEWIN: You need to look at the context that you’re reading or listening to it in. Because often there’s a bigger picture. The data all tells a story, and it just depends on the context that we’re reading it in.
ALEX HAGER: And when it comes to snow, that context is that there is less than there used to be. And that is already having big implications for the Colorado River.
IRA FLATOW: Wow. Thank you for filling us in on those implications, Alex.
ALEX HAGER: Thanks for having me.
IRA FLATOW: Alex Hager, Water in the West reporter for Public Radio Station KUNC, in Fort Collins, Colorado.
Copyright © 2022 Science Friday Initiative. All rights reserved. Science Friday transcripts are produced on a tight deadline by 3Play Media. Fidelity to the original aired/published audio or video file might vary, and text might be updated or amended in the future. For the authoritative record of Science Friday’s programming, please visit the original aired/published recording. For terms of use and more information, visit our policies pages at http://www.sciencefriday.com/about/policies/
Kathleen Davis is a producer and fill-in host at Science Friday, which means she spends her weeks researching, writing, editing, and sometimes talking into a microphone. She’s always eager to talk about freshwater lakes and Coney Island diners.
Ira Flatow is the founder and host of Science Friday. His green thumb has revived many an office plant at death’s door.