Witnessing Environmental Change From Space
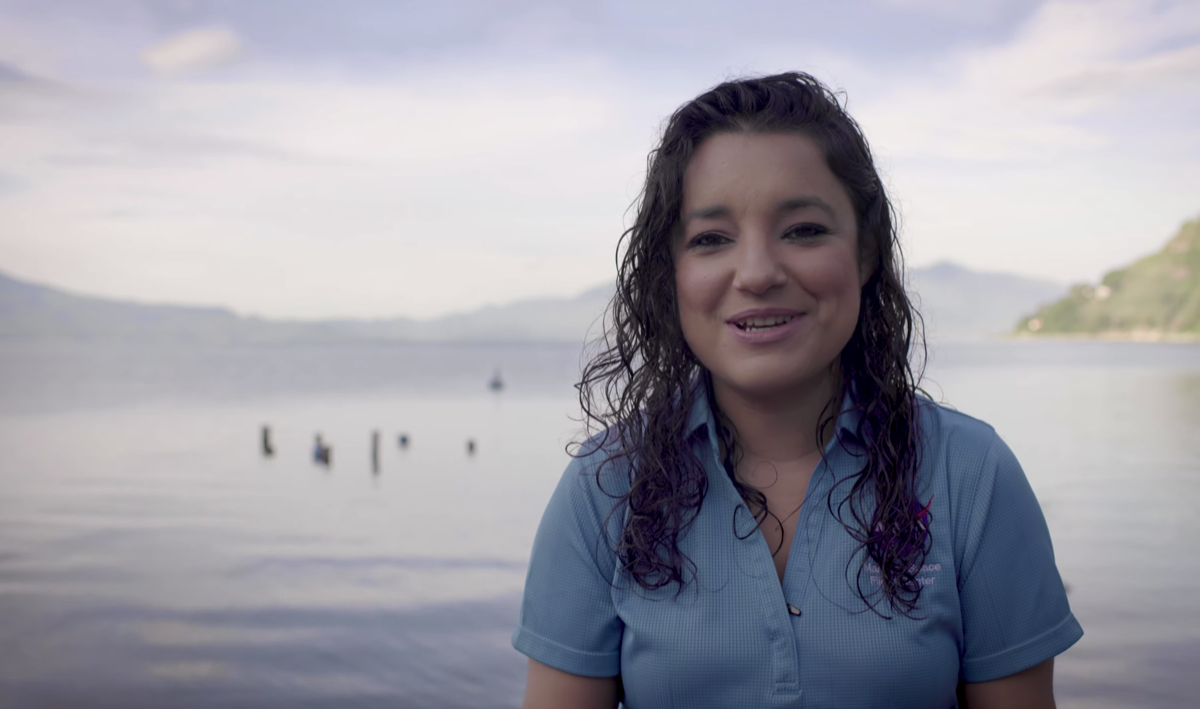
From deforestation to algal blooms, NASA earth scientist Africa Flores-Anderson monitors the planet through satellite images and data.
This article by Cassie Freund was originally published on Massive Science. The story is a part of Breakthrough, a short film anthology from Science Friday and Howard Hughes Medical Institute (HHMI) that follows women working at the forefront of their fields. Learn more and watch the films on our Breakthrough spotlight.
Some scientists look at miniature worlds through microscopes, and some take a larger view by looking at Earth from space. Africa Flores-Anderson is one of the latter: a National Geographic Explorer originally from Guatemala, she works for SERVIR, a collaboration between NASA and USAID that monitors our planet from satellite images, and is just starting a PhD in Renewable Resources at McGill University. One of her active research projects is studying the impact of algal blooms on the water quality of Lake Atitlán in Guatemala. She talked with Massive about her science passions, the different types of satellites she relies on, and how remotely-sensed images can fundamentally change how we see the world.
Cassie Freund: So, I gather that you look at Earth from space for a living. Can you tell me a little bit more about that?
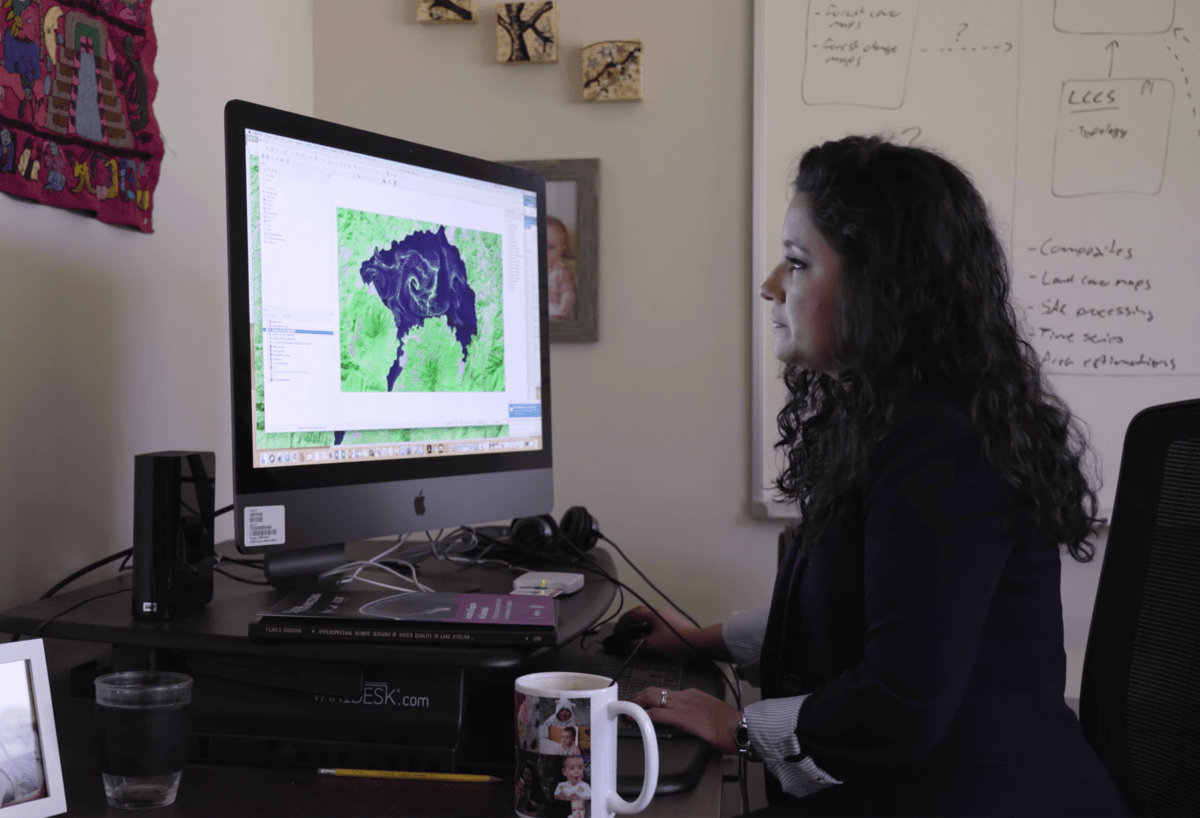
Africa Flores-Anderson: We use satellite imagery to understand our planet. I focus on environmental monitoring, to use satellite imagery for a range of different applications but particularly to identify land cover change and monitoring for water quality. And that’s where I had been focusing a lot, using satellite data to monitor water quality in Lake Atitlán.
There [are] two main sources of satellite information. One is passive. So what the sensor is recording is either the energy that is being reflected from the sun back to the sensor, or the energy that is being emitted by the body that we’re looking at. So, in short the sensor doesn’t have its own source of energy, it is just measuring what it’s getting, what is being reflected or what is being emitted. The other type of satellite data is active remote sensing, when the sensor emits its own source of energy. LiDAR, Light Detection and Ranging, goes into that and Synthetic Aperture Radar (SAR) also fits into that category. (Ed: LiDAR and SAR are both methods to measure and map features on Earth’s surface using lasers and radar, respectively).
It’s amazing how research has changed since the dawn of all of this technology. What are your thoughts on that?
Well, I think that we are in a unique era for using satellite data. Even when I started to work with them, which was like in 2006, we didn’t have freely available satellite images. Landsat was already there, but it wasn’t freely available. It became freely available in 2008 and I think that that completely changed how we are able to use this type of data for decision making. Because Landsat became free, that opened everything for other missions to release their data, to also make the data freely available. Now every year that passes I feel like we have more sensors, more data that is available. And not only passive [data], but also active, with the European Space Agency also releasing Sentinel 2 which is optical and Sentinel 1 which is synthetic aperture radar. We never had that before. I think that the future only looks brighter in terms of the data that is available because there are more missions that are being prepared and launched. And I think that now, you know, in the past you just [made] do with one image, because it was hard to get one image. At first maybe you had to buy it and the computer resources that you needed to process it. And we are not only making data more accessible by making it freely available, but also the computer capacity has improved and increased and so we can work with more than one image. Now we can make temporal analyses and look at changes from image to image, compared to just looking at one image at a time.
So it is completely different, what we can do now [compared to] what we could do in the past. And it just looks better in terms of everything because now we can look at different components, different characteristics of the same spot.
Invest in quality science journalism by making a donation to Science Friday.
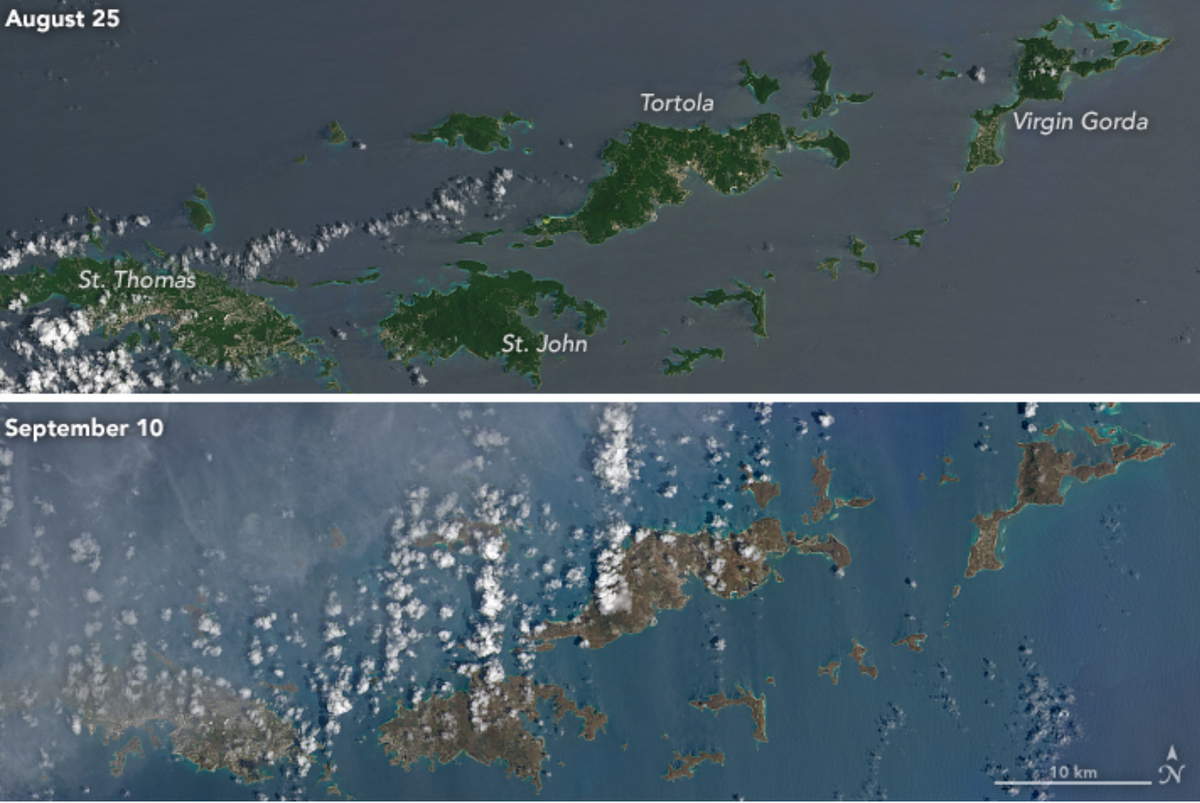
A side-by-side comparison shows the effects of Hurricane Irma, turning islands in the Caribbean brown. Credit: NASA
That’s a great point. You mentioned decision making, being able to apply your science to policy or give it to managers. Do you think the fact that you’re dealing with pictures and images makes a difference to those people who are making the decisions, like being able to see it with their own eyes?
Yes, definitely. You know, they say that one picture is worth more than 1,000 words. That is true. In fact, the program that I work for, SERVIR, is a joint initiative between NASA and USAID. And [SERVIR] started because they were using satellite imagery to monitor the forest in Petén Guatemala. I’m originally from Guatemala. The border between Mexico and Guatemala was very visible in the Landsat satellite imagery at the time, because the Mexican side was completely deforested and the Guatemalan side still had a lot of forests. And that image [of the two sides of the border] became crucial, and the main reason behind the fact that the largest protected area in Guatemala was created, the Maya Biosphere Reserve. It was because of that satellite image, that showed so clearly from a space the intact forests from the Guatemalan side and the agricultural expansion, deforestation from the Mexican side.
And, you know, that directly had an influence on decision making, and then because of that the Protected Areas council in Guatemala was established as well. So it had a lot of implications. But I think that satellite data has become evidence regarding how we are using our natural resources, and it becomes something that we can show to decision makers and policy makers about the impacts that humans are having on in the environment, [in a way] that everyone can understand. It is easier to communicate.
That’s so interesting. I’ve never heard you know that story about the creation of the Guatemalan protected areas. That’s really cool.
Yeah, and I think that that’s also the narrative of our program behind how to use geospatial technology and observations for decision making, to improve decision making, to inform decision making. Because definitely, if it’s used in the right way it can have that impact on the ground. It is hard, but it can.
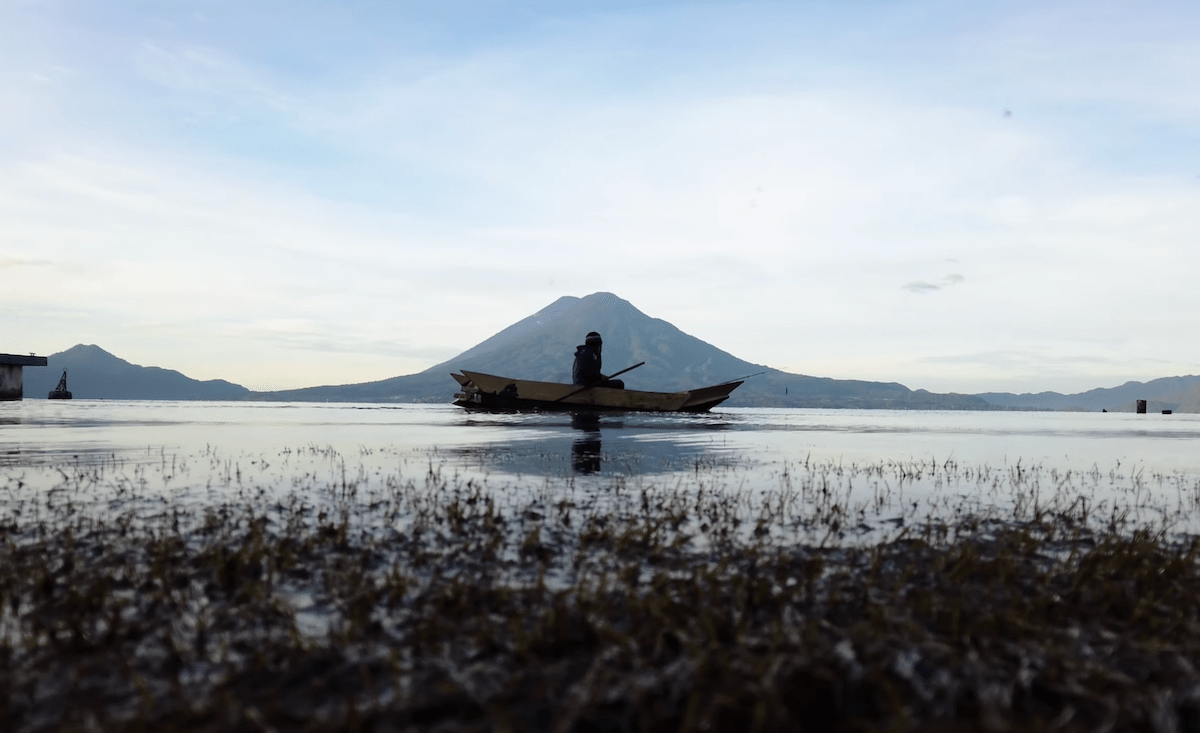
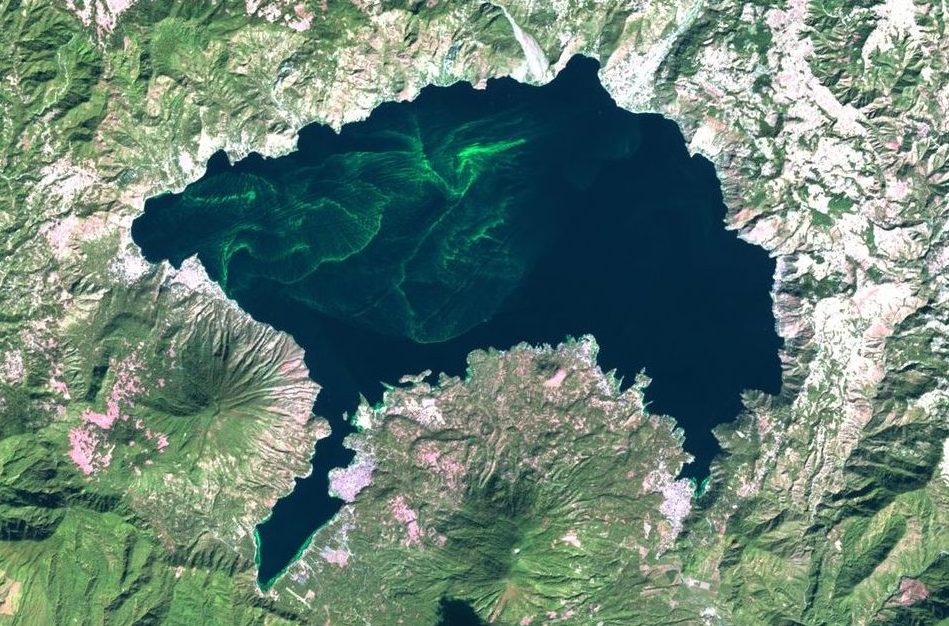
Lake Atitlán. Credit: Science Friday
Are you working on something specific at the moment?
Well, I’m working on Lake Atitlán, which is this beautiful lake in Guatemala, the second most visited site in the country. It is a beautiful lake surrounded by volcanoes. And [I’m working on] a grant that that we got from National Geographic and Microsoft to monitor and forecast algae blooms in Lake Atitlán. We are using satellite technology to identify when algae blooms occur and how long they have lasted. But we are also using other sources of satellite data as variables that have explanatory value of when and why the algae blooms are happening. We use machine learning or artificial intelligence to do the analysis. Some of the main results [are] that runoff and precipitation [have large effects] in terms of when algae blooms are forming in Lake Atitlán.
That’s one of the things I’m working [on] directly linked to my country and where I have been able to pay back everything that my country has given me, like the passion to study environmental sciences and the interest to conserve and protect our resources in the country. And the other topic I have been working on is using synthetic aperture radar for forest monitoring and biomass estimation. We released a book…. last year? 2019? (laughs) I lost sense of time.
That was worked [on] by six different experts on synthetic aperture radar, trying to collect all the methodologies and apply knowledge about how to use this technology for forest monitoring and biomass estimation.
The other thing is that now we have data that we can use on [an] operational basis for using SAR, Sentinel-1. SAR has been around for a long time, but it wasn’t freely available. But now the European Space Agency produces this data for free. NASA is also preparing and about to launch into a new mission together with the Indian Space Agency, ISRA. The mission is called NISAR and the data is going to be freely available.
So we are preparing ourselves for this new mission that is going to provide freely available SAR. There are some archive data from ALOS-PALSAR, which is [from the] Japanese space agency. That is historical, but we also can use it for free. There are a lot of resources but there is not that much capacity in how to use this type of technology on an operational basis. So that has become my new interest and passion right now—how to make these more usable and to try to extract as much information as possible [from] these new data sets.
Sounds like a big job.
Yeah. And it’s a bunch of us, of course. I rely so much on experts that have been doing this for a long time. And it has been a very nice and fruitful collaboration.
So you study lakes, you study tropical forests. Is there another type of ecosystem that you eventually would like to get into?
(Laughing) No, that’s a lot. I want to keep working on Lake Atitlán but maybe some of my research is going to be going more towards land cover for forests, but we will see. And I know that I have to focus on one thing. But my brain is always working…
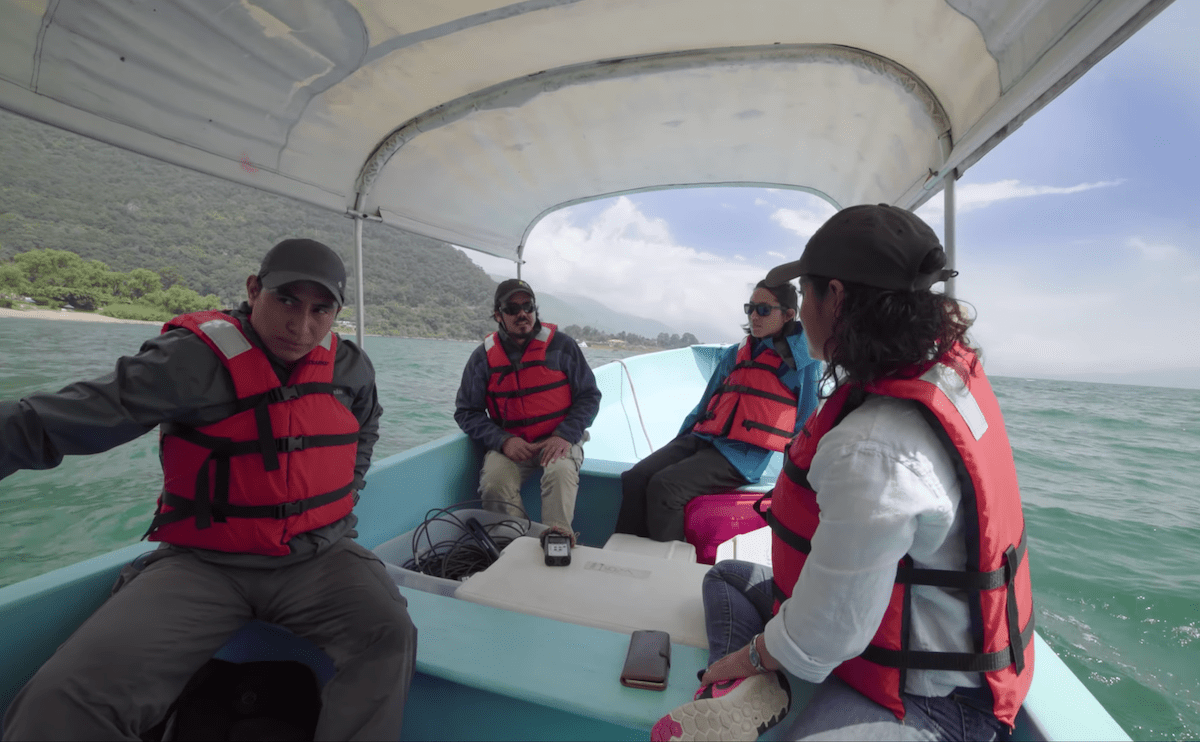
Yep, I understand. Do you ever get to travel? Do you ever do field work to ground truth what you’re looking at, or do you mostly rely on collaborations to do that? [Ed: “Ground truth” means to go look at and confirm something in person that you saw on a satellite image]
We rely a lot on collaborations. For example for Lake Atitlán we work very closely with entities that work on the lake like the Lake Authority [the Lake Authority for the Sustainable Management of Lake Atitlán Basin and its surroundings]. There is a university, Universidad del Valle de Guatemala, that has a campus near the lake. There are also other groups that are collecting water quality data around the lake and we partner with them. And so we have gotten in situ observations of this field work from them. I have gone a few times to the field, I have to admit that I used to do that more in the past, but now it is mostly through collaborations that we get the field data.
For water quality, the field observations are key, because that’s the way that we calibrate and validate our analysis using satellite data. The best way [to obtain the measurements] so far has been through these collaborations, but also with the advance of technology, now we can use high resolution data to obtain those in situ observations, particularly when we are talking about land cover because that’s quite easy to identify with high resolution data if you know the landscape. So, I will feel very comfortable, you know, doing some collection of data over Guatemala for land cover and land use change as long as I have the high resolution data to do it. A lot of this world has become very sedentary (laughs). Because the technology advances have been very significant we have these different sources of high resolution data that, given the limitations of price or accessibility, they may not be used to create the map itself. But we can use them for the calibration and validation. We are just inundated with information, with data. Which is good. It’s a good problem to have.
“I think that just to see what the surface of the Earth looks like with other lenses is beautiful.”
That’s true. Have you always been interested in making maps?
Since I learned geographic information systems [GIS]. Yes. It was an elective course in my undergraduate in when I was studying in Guatemala. It was just GIS and I really liked it, and then I was the one in the group making the maps and I stayed working with it because it was so interesting and nice to be able to see the information that we had collected in the field (at that moment, I was doing a lot of fieldwork) in a two-dimensional plane and to see it on the map. It was very, very nice. And since then I stayed doing Geographic Information Analysis.
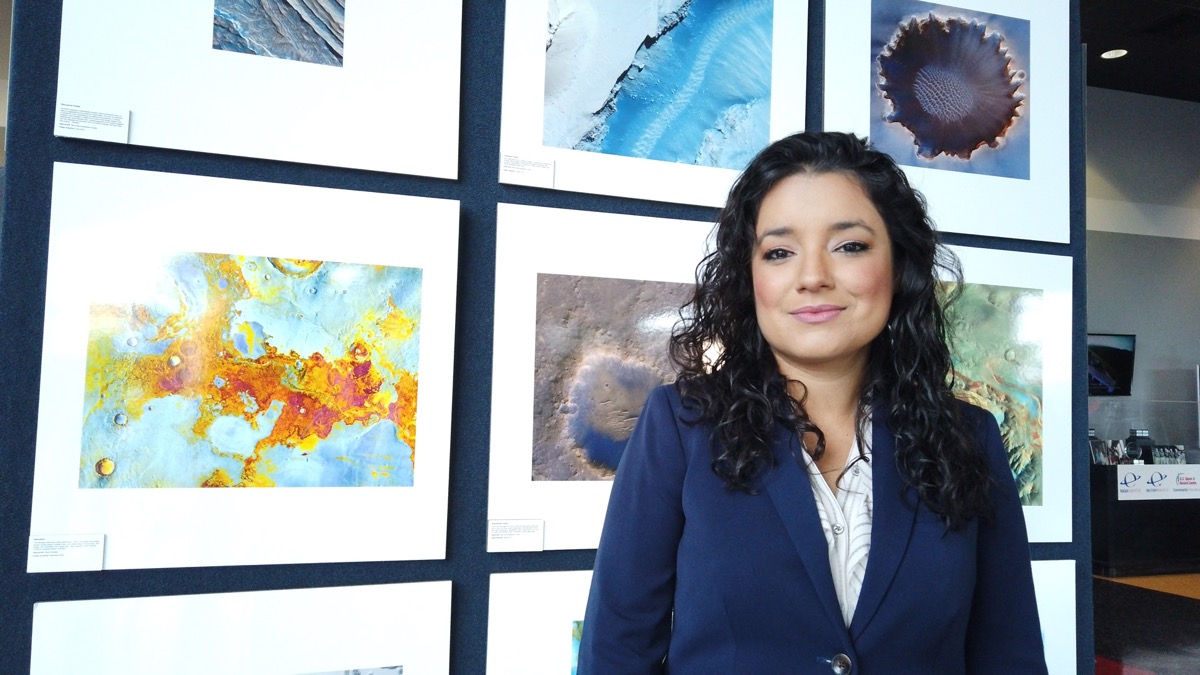
Credit: Science Friday
I just have one more question for you: I’m wondering if you can describe the most beautiful thing you’ve ever seen on a satellite image.
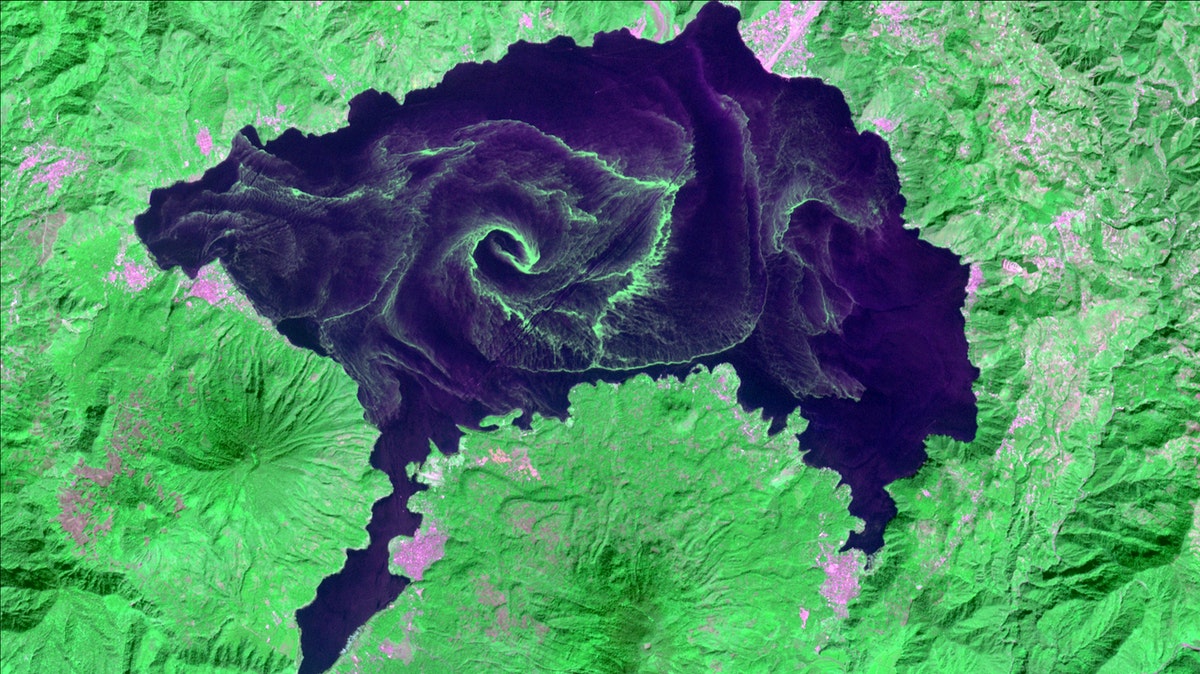
Oh, that’s interesting. Let me see. There are a lot of very nice…there is one image that I really like. [It focuses on] how to represent the things that we cannot see with our eyes, because, you know, we collect information in different parts of the electromagnetic spectrum. What we can see is only in the visible part of the spectrum. So that’s why we can see images in RGB [red-green-blue, the usual coloration scheme in photographs] that are very compatible with what we see on the ground. And that makes interpretation very easy: this is water, this is forest, this is soil.
But we also collect information in other parts of the electromagnetic spectrum like the near infrared. And SWIR (short-wave infrared) and we cannot see that with our eyes. And when we combine all of that information you create beautiful false color images that mean something—for example, vegetation reflects a lot in the near infrared. Healthy vegetation is a super bright color and we cannot see that with our eyes. So having that understanding and having that information, visualizing it is very nice. There is a nice image, a false color image for Lake Atitlán that just looks beautiful. The lake was clean at the moment and you can see the mountains, the forest, the agriculture around in the basin around the lake, with different colors—it is not a natural color image, it is a false color image. But it just looks so, so beautiful.
And I think that just to see what the surface of the Earth looks like with other lenses is beautiful. And it means something! When you go to those bands and you say, oh, it is bright because maybe it has more chlorophyll or it has less chlorophyll, or because it has this constituent and not this one. It makes so much sense when you get into the details as well. So for me, that’s very, very interesting to see what my eyes cannot see.
That was a wonderful answer.
There are a lot of very beautiful images like that. And we create them using these other bands, this false color images, and they look amazing and some in the RGB, just in the natural color, they also look beautiful. But the Earth is beautiful, honestly.
Cassie Freund is an editor for Massive Science, and a tropical forest ecologist and Ph.D. student at Wake Forest University.