Grade Level
4-8
minutes
1- 2 hrs
subject
Life Science
Activity Type:
build a model, analyze and interpret data, ecosystem interactions
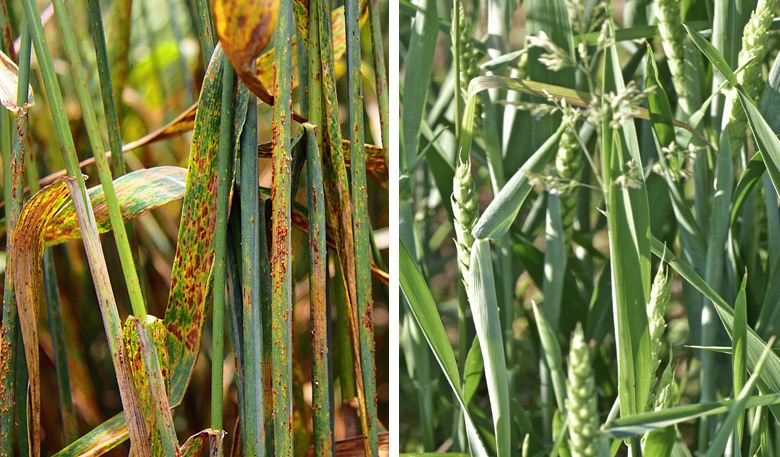
What do you notice about the leaves of the wheat on the right? How about on the left?
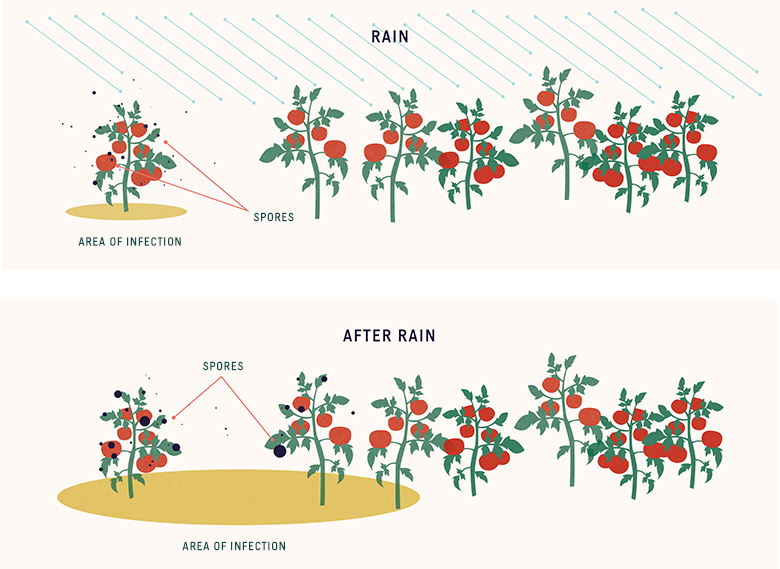
See those yellow and red spots on the leaves on the left? Those wheat plants are sick. They have a disease called wheat leaf rust. Wheat leaf rust is caused by a fungus, and like many fungi, it spreads from place to place in tiny particles called spores. When wheat rust spores land on the leaves of a healthy wheat plant, that plant can become infected. According to the Cereal Disease Lab, wheat rust absorbs nutrients from the plant tissues and makes that plant more susceptible to infection by other fungi and bacteria.
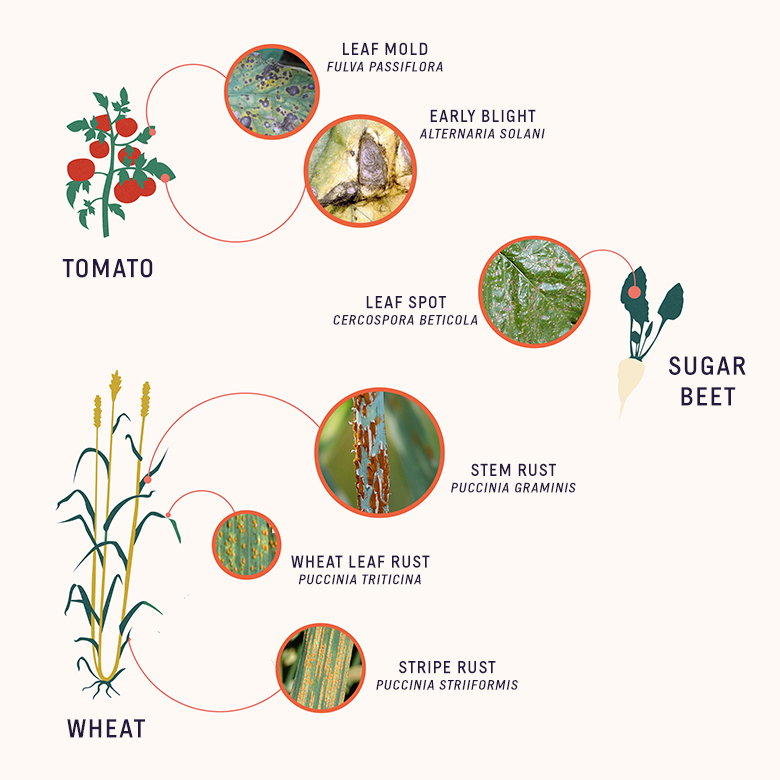
Wheat leaf rust (Puccinia graminis), can become a serious problem for a farmer if left untreated, but it isn’t the only plant pathogen that can cause crop damage. There are thousands of species of fungus or fungus-like organisms that cause diseases in plants and animals. Most pathogens in this group are specialists, meaning they infect only one or a few different species, but fungi are the leading cause of crop loss worldwide, and the problem may become worse with longer periods of warmth and moisture due to climate change. Chemicals called fungicides can be used to kill disease-causing fungi, but they can be expensive and sometimes dangerous to people.
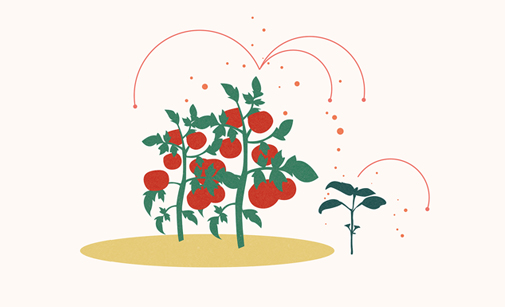
Part of tackling the problem of plant disease is to figure out how these infections move from plant to plant. In the following activity, you will model disease transmission between plants by rain, then devise a way to reduce the spread of a pathogen like the one that causes wheat leaf rust.
How Do Diseases Move From Plant To Plant?

Many human diseases are transmitted through violent expiration events, like coughs or sneezes. These clouds of droplets can carry pathogens and even suspend them in air. But plants don’t sneeze, so how are diseases spread from plant to plant in a field or greenhouse?
To answer this question, let’s start by thinking about the abiotic (nonliving) and biotic (living) factors present in the ecosystem that the plant belongs to, even if that ecosystem exists inside a greenhouse or on a farm. What could move a fungal spore from one plant to another? How could abiotic factors influence the transmission of a (biotic) fungal pathogen like wheat rust?
Breakthrough: Connecting The Drops
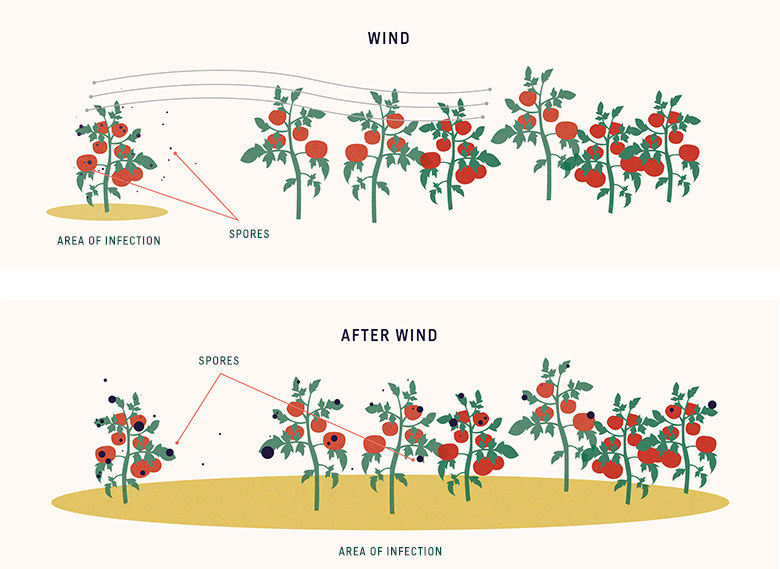
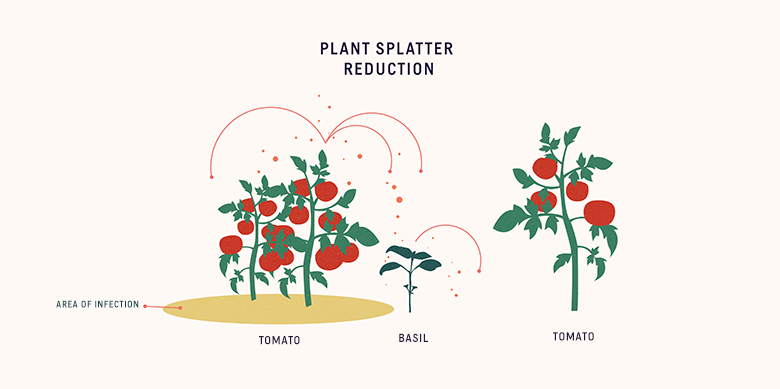
Diseases that attack the leaves of a plant are primarily spread by wind, but they can also move to nearby plants by taking a ride on splashing water droplets from rain or irrigation. How can we change how crops are planted and grown to minimize the spread of pathogens by water droplets?
This is one of the questions that Lydia Bouriba, a scientist studying fluid dynamics at the Massachusetts Institute of Technology, attempts to answer with her research. Her lab studies how small droplets can transmit plant and human diseases.
Raindrop Range Of Contamination.
How far can fungal spores travel in water droplets that splash off an infected plant? In the following investigation, you will drop water onto the leaf of a plant and analyze the size and distribution of the droplets that splash off the leaf. Based on your data, you will make a recommendation to a farmer preparing to plant tomatoes in a greenhouse.
Note: For the purposes of this investigation, we are only addressing disease that can be transmitted by droplets.
Plant Observations.
Before starting your splatter investigation, examine the leaves of your plant and make a list of observations. Observe things like how much each leaf bends, the size and texture of the leaves, and any other physical traits. Which of those traits that you observed might affect how far a droplet will bounce off the surface?
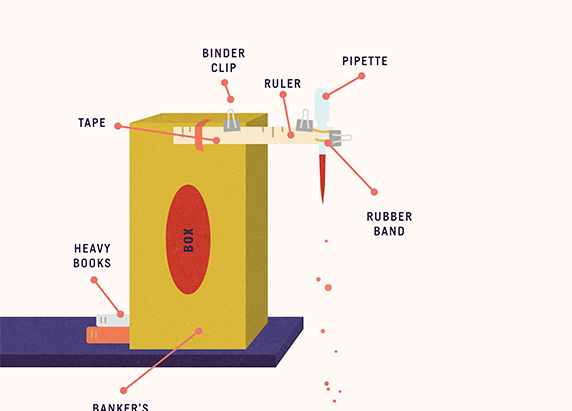
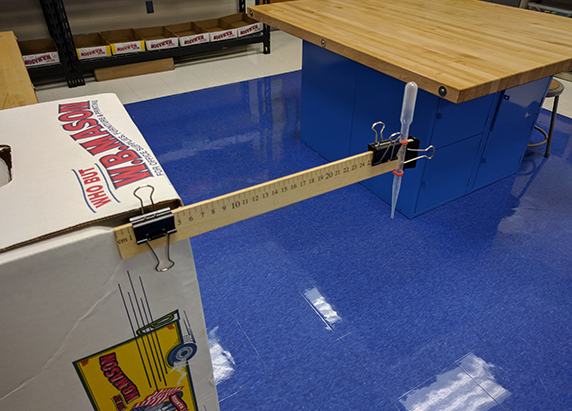
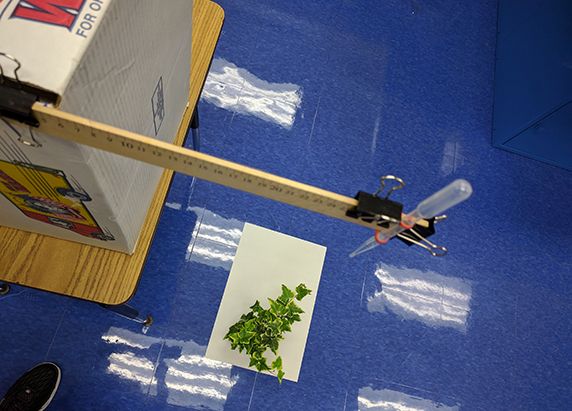
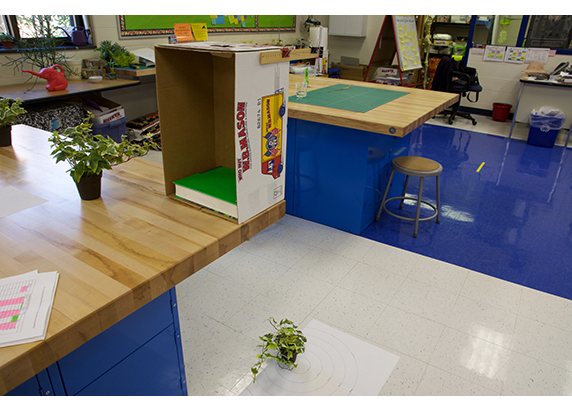
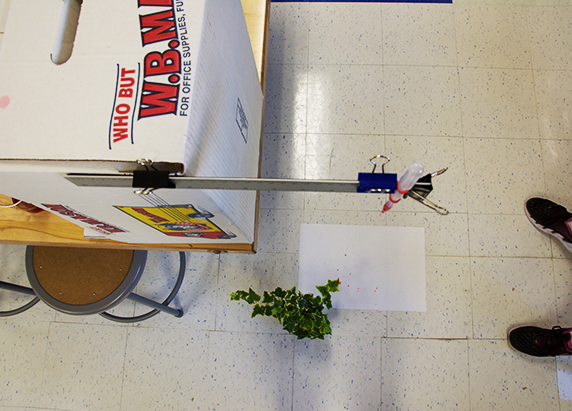
Materials (Per Group Of 2-4 Students).
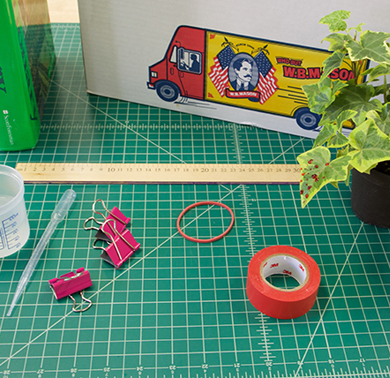
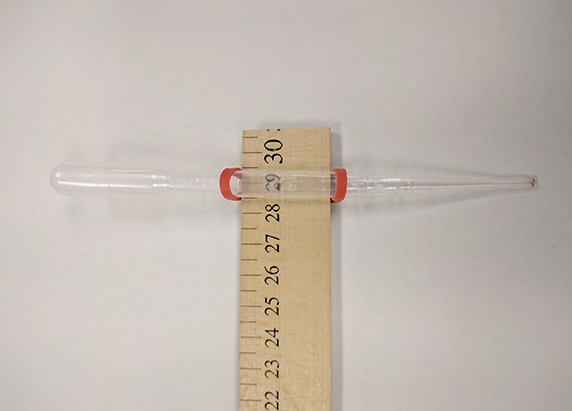
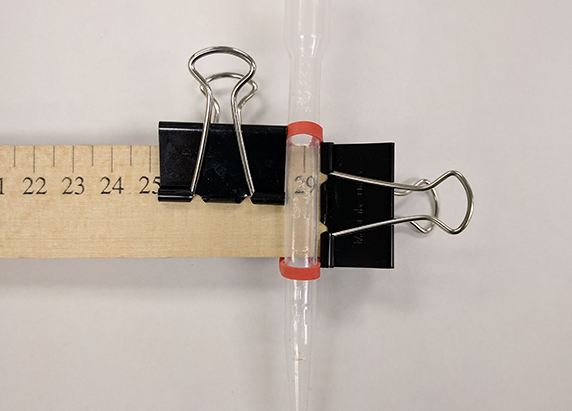
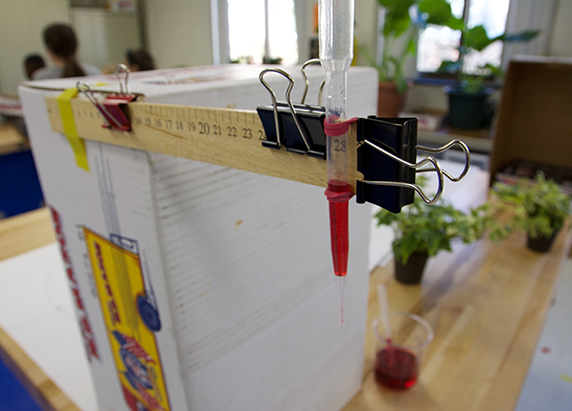
- Small (3mL) plastic pipette or eyedropper
- Ruler
- Rubber band
- 3 medium binder clips
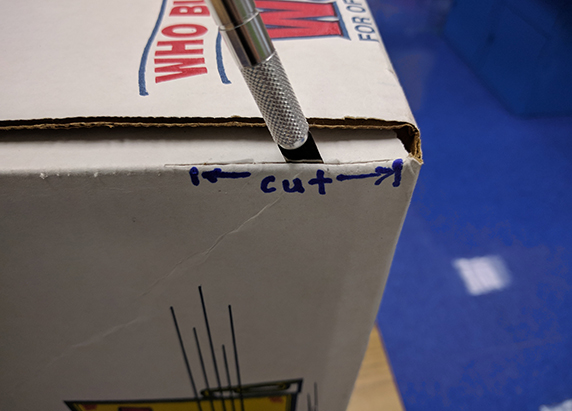
- 1 box (a printer paper box works well)
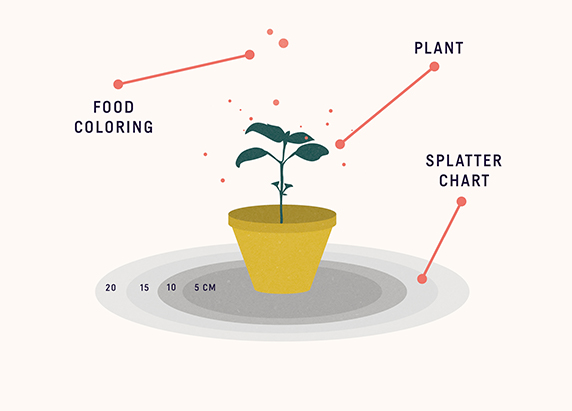
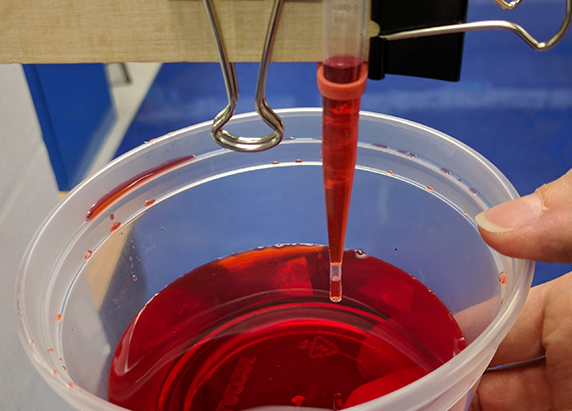
- 25 mL water, tinted with food coloring
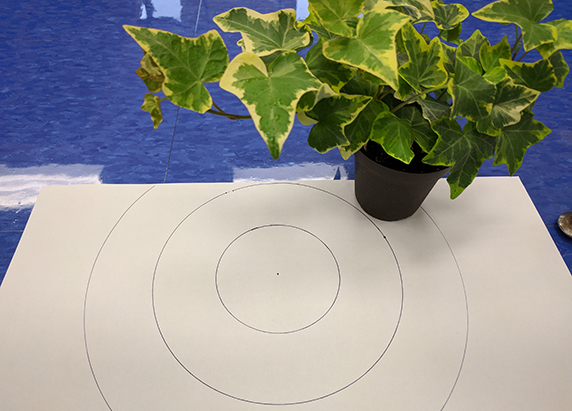
- Small potted plant
The plant should be upright, but does not have to be one of the crops we’ve discussed. We recommend a common ivy houseplant, such as Hedera helix, or a philodendron. - Polar graph paper
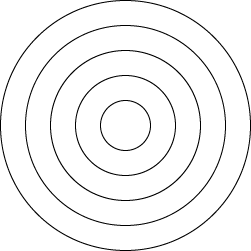
Create your graph paper by drawing concentric circles with diameters at 5 cm, 10 cm, 15 cm, 20 cm, and 25 cm using this technique. Draw an X in the center and label “Leaf tip.” - 2 colored pencils (different colors)
- Optional: Yard stick to help center your leaf under the pipette or eyedropper
- Optional: Drop cloth to protect floor
- Optional: Camera or phone with video recording set to burst or slow motion
Conduct The Experiment.
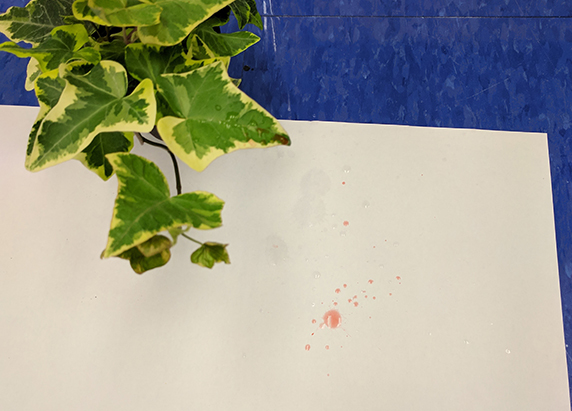
- Release one tinted water droplet.
- If you are using a camera, take a photo of the splatter by placing your camera within the camera positioning marks.
- Make a note of any drops that seem to combine to form “super splatters,” pools of more than one drop.
- Repeat for five water droplets.
- Carefully remove your plant and move your polar graph paper so it can dry. You can carefully blot it with a tissue to speed up the drying process.
While Paper Is Drying, Discuss Your Observations.
- Where are the largest (>5mm) splatter droplets located? Why do you think they landed where they did?
- Where are the smallest splatter droplets located? Develop a hypothesis for why droplets might travel different distances based on whether they are large or small.
- Did any of the droplets splatter beyond your graph paper? Were they large droplets or small droplets?
Back-To-School Lessons From Science Friday’s Educator Collaborative
Collect Splatter Data.
- Count the large splatter droplets that fell in each circle band. Write the total for each inside the respective circle band. As you count, cross out the droplet with a small “x” so you only count it once.
- Count the small splatter droplets. Using a different color, write the total inside the circle band in a different color. Again, cross out the small droplets with a small “x” as you count.
- Repeat, counting and recording the small and large droplets within each band.
- Create a histogram that shows the range of large and small drops from your polar graph paper.
Analysis Questions.
- How might droplet size affect how fungal spores are passed to other plants?
- Describe the pattern of droplets. How far away from your plant would you expect spores to spread?
- What was your maximum droplet splatter range? Examine the other leaves on your plant. Do you think you would get the same result for each leaf? What might determine how far droplets spread for any particular leaf?
Make A Recommendation.
Based on the information from your plant splatter experiment, make a recommendation for changes to plant spacing or the irrigation system in a greenhouse growing that plant. In your recommendation, please be sure to refer to your splatter test data and explain your rationale for your recommended changes based on that data. Take the following into consideration:
- In a field or greenhouse, you are dealing with the splatter of many plants in many directions.
- Farmers must be able to make a profit off their crops, and try to grow as many plants as possible while losing as few plants as possible to disease. Try to space plants to minimize disease, while maximizing the amount of plants that can be grown in a given area.
- Are there other changes you might recommend to this farmer? Be sure to explain how they will reduce disease transmission.
Reflection Questions.
- The droplet splatter setup in this experiment is a model that helps us explore the interaction between one droplet and one leaf. What are the limits of this model? What parts of real rainfall does it fail to represent?
- Redesign this droplet splatter investigation or design a new investigation that would address some of the limitations you identified in the previous question.
Extensions.
- Develop a formula that optimizes output (crops per square meter), but minimizes disease transmission. Be sure to take the growth of the plant (size) and the maximum range of contamination. What information would you need in order to be able to apply your formula before you planted any crops? How would your formula need to change in order to be applicable to different types of plants?
- Repeat the experiment above, but using a crop grown in your region. Try to find a model plant that best mimics the leaf properties of that crop if you cannot use a real one. Interview local farmers about techniques, aside from fungicide, that they use to control the spread of fungus in their crops. Based on your interview with farmers and experimental data, write a recommendation for plant placement.
- How can we change how crops are watered to lessen diseases that are spread by droplets? Design an experiment to test how different watering methods might increase or decrease spread of disease by droplets.
Related Resources.
Breakthrough: Connecting the Drops
Bacteria and viruses hitch a ride inside droplets of all kinds—sneezes, raindrops, toilet splatter. By reviewing footage of different types of drops, applied mathematician Lydia Bourouiba records and measures where they disperse in order to better understand how diseases spread. Watch how Bourouiba designs tests—some inescapably humorous and awkward—to study infectious disease transmission.
Raindrops splash down on leaves, spread pathogens among plants.
Bouriba describes the work of a team of researchers from MIT as well as the University of Liege, in Belgium, that uses high-speed images of raindrops splashing down on leaves to show that raindrops can act as a dispersing agent of contaminated droplets from one plant to another.
Next Generation Science Standards.
Disciplinary Core Ideas
LS1A. Structure and Function
LS2.A: Interdependent Relationships In Ecosystems.
Science and Engineering Practices
Developing and Using Models
Planning and Carrying Out Investigations
Analyzing and Interpreting Data
Cross Cutting Concepts
Cause and Effect
Structure and Function
Systems and System Models
Credits.
Resource writing and photography: Beth Topinka, Xochitl Garcia
Illustrated diagrams: Ari Tiziani
Editing: Ariel Zych, Laura Helft, Johanna Mayer
Digital Production: Johanna Mayer
If you have questions about this resource or would like to share your experience using it with students, please e-mail us at educate@sciencefriday.com or tweet to @scifri
Meet the Writers
About Xochitl Garcia
@msxgarciaXochitl Garcia was Science Friday’s K-12 education program manager. She is a former teacher who spends her time cooking, playing board games, and designing science investigations from odds and ends she’s stockpiled in the office (and in various drawers at home).
About Beth Topinka
@BTopinkBeth Topinka is the S.T.E.A.M. lab teacher for grades 2-5 at Millstone Township School District in central New Jersey. She’s a vocal advocate for interdisciplinary, problem-based learning, and was recently selected as a state finalist for the 2016 Presidential Awards for Excellence in Mathematics and Science Teaching.