
Grade Level
9 -10
minutes
1-3 hours
subject
Physical Science
Activity Type:
analyze and interpret data, Waves
 When the earth shakes, it can mean a lot of things: an earthquake, a truck driving by, or even a World Cup victory. During the 2018 World Cup, soccer fans in Mexico jumped and cheered so much after Mexico scored a big win that earthquake sensors were set off by their celebration! By measuring the ground’s vibrations, you can learn a lot about what is happening both near and far away.
Vibrations travel through the ground as mechanical waves. Mechanical waves are energy that is being transferred as the movement of matter. Waves are all around us, from the sounds you hear listening to the latest episode of Science Friday to the shaking you feel beneath your feet as a large truck passes by. Mechanical waves can travel through a medium like the air, ground, or water for miles.
When elephants are running away from poachers who are trying to kill them, their massive bodies exert a large amount of force and energy into the ground that travels through the ground as wave vibrations. These waves can travel miles from where they originated. By analyzing mechanical waves that travel through the ground (or in water or air) you can learn a lot of valuable information about events that may be happening far away, and potentially even use your analysis to help protect elephants from poaching.
A Stomp, A Roar, An Elephantquake?
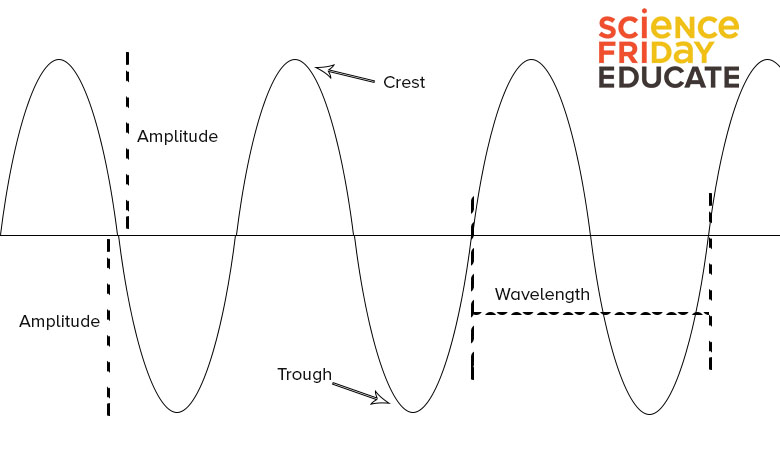
The shape of a wave can be described by its wavelength, amplitude, and frequency. For a transverse wave that has peaks and valleys like an ocean wave, the wavelength is the distance from one wave peak to the next. Amplitude is a measure of the maximum height of a transverse wave. For a longitudinal or “compression” wave, wavelength and amplitude are defined a little differently; wavelength is the distance between compressions, and amplitude is the maximum displacement of particles in the medium within each compression. The frequency measures how many waves (or compressions) pass by in a given amount of time. You can investigate all three of these properties of waves using the “oscillate” setting in the following simulation to see how a greater force or motion can alter these three properties.
In this lab activity, you will learn about researchers who have figured out how to use the frequency and amplitude of vibrations in the ground caused by elephant movements to figure out what elephants far away are up to. You’ll then use the accelerometers in a smartphone or tablet to generate and analyze seismographs of the behaviors of you and your classmates. So grab a device, and let’s get started.
Tools To Detect Vibrations In The Ground
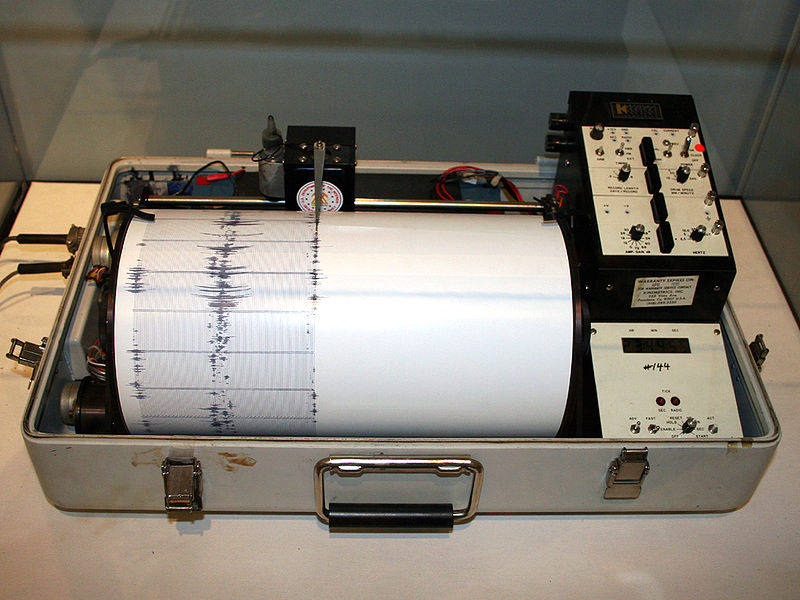
Scientists use a variety of sensors to measure the motion of the ground. One example is called a seismometer. A simple seismometer can just be a hanging pendulum with a pen attached to it, so that when the ground shakes, the pen moves and makes a mark on a paper below.
Imagine that you jump up and down next to a device like this. When you jump, the ground will move a little. When the ground moves, it will shake the pendulum, and when the pendulum moves, the pen will draw on the paper. The recordings created by these seismometers are called seismograms. Today’s more sophisticated seismometers can transform the motion of the ground into an electrical signal so that the data can be recorded and analyzed digitally in real time.
Smartphones contain acceleration sensors, or accelerometers, that can work like a seismometer to record how the phone shakes. If you put the phone in the right place, you can use it to detect how the ground moves. There are even apps like MyShake that can gather data from your phone to look for the type of motion that happens during an earthquake. The app helps scientists measure real earthquakes by collecting data from people’s phones all over the world, so you can help scientists by installing this app for yourself!
Human Vibrations
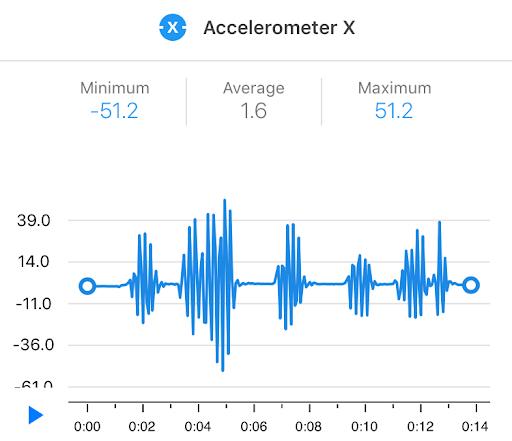
The sensors in your phone can be recorded by apps like Science Journal. How can you use the wave properties from an accelerometer signal to distinguish between different human activities?
How does the waveform look different when you are walking or dancing? When do you see the largest amplitude or highest frequency? Could you tell the difference between the vibrations formed during a basketball game or a volleyball game?
Elephantquakes?
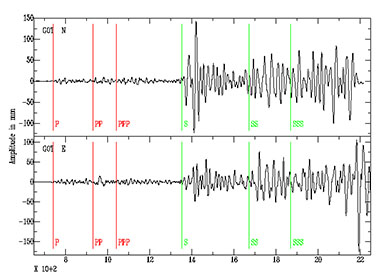
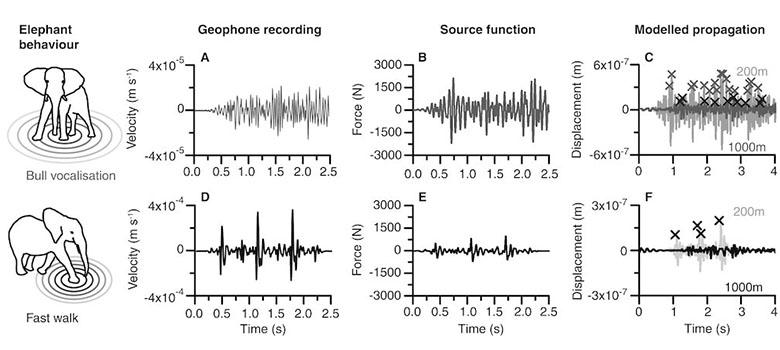
If a sensor can pick up the motion of a person based on vibrations, imagine what happens when a huge animal like an elephant walks around. Beth Mortimer and Tarje Nissen-Meyer have measured signals from seismological sensors called geophones when elephants walk, run, play, or communicate, even from a few miles away. The amplitude and frequency of the waveform detected by these sensors were analyzed to determine what activities the elephants were doing. Using these signals, researchers could determine whether the vibrations were caused by normal activities, or by elephants running or responding to threats . Researchers hope this sort of seismological monitoring could one day be used to identify where and when elephants might be at risk from poaching.
Use this chart to come up with what you’d like to know more about and what you think you may know already based on the information from Beth Mortimer and Tarje Nissen-Meyer.
Part 1: Play With A Science App!
- On a smartphone or tablet, install the Science Journal app (called Science Journal by Google on iPhone or Android).
- Enter your birthday and answer the other prompts to set up the app.
- Click the plus sign (+) in the lower right corner to start a new experiment.
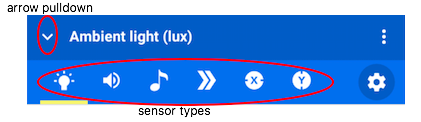
- Choose the waveform icon to view the sensor data.

- Pull down the arrow next to Ambient light to view the other sensor types, and try each sensor type. Which sensors seem to measure the phone’s motion?
Part 2: Record Movement Using Three Axes.
Use the app to explore your ability to record motion using the x, y, and z axis. Place your phone on its side, front, back, or standing up on a table or on the ground. Try walking, jumping, dancing, or anything else near the device to see what measurements your app is able to record. Use the app’s graph for each to attempt to pair simple basic movements with their corresponding measurements. Try to answer the questions:
- What do the measurements for jumping up and down look like on the app?
- What does running by the sensor look like compared to walking by?
By the time you finish try to be able to identify at least three movements simply by looking at the app’s measurements.
Part 3: Record Behaviors Of Different Amplitudes And Frequencies.
 Waves can have a multitude of different appearances. Using the app, lets try to create data sets that can exhibit some of the traits that are used to describe different waves. Test out your knowledge of waves and their properties using the app with the section below.
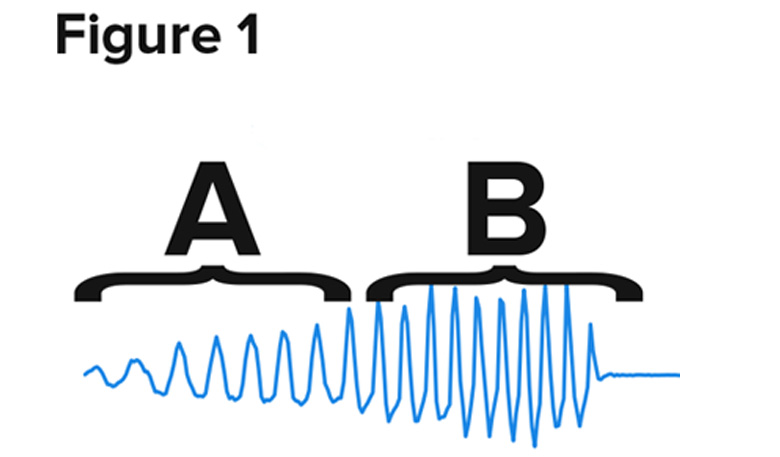
Frequency is the measure of how many waves pass by in a specific amount of time. Something with a high frequency would then have a large amount of waves passing by or being generated in a short amount of time. In the Figure 1 to the left, waves are being generated in both section A and section B. However, there appears to be a difference between those two sections.
- Using your knowledge of what frequency is, try describing the difference between section A and section B in Figure 1 above.
- Which of these two sections in Figure 1 has the highest frequency? Support your claim about which section has the highest frequency by citing specific evidence from the image above, and then explain the reasoning behind why that piece of evidence proves your point.
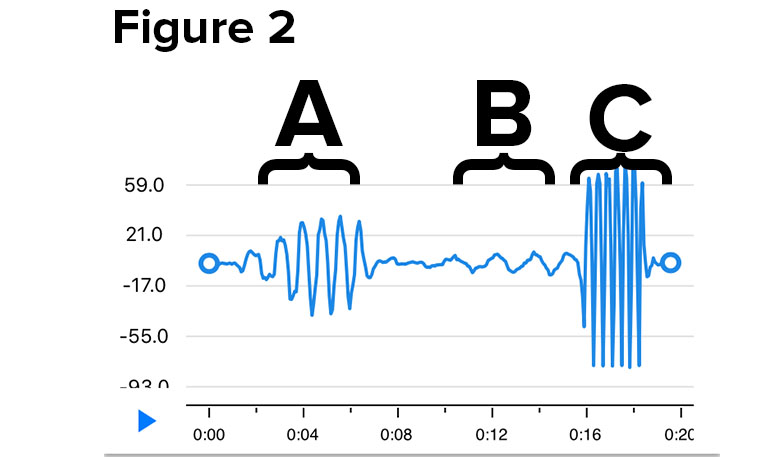
- Waves have other important features such as amplitude, which is the size of the wave’s crest from the center point. Which of the three sections above has the lowest amplitude? Support your claim about which section has the lowest amplitude by citing specific evidence from the image above, and then explain the reasoning behind why that piece of evidence proves your point.
- Wavelength is the distance from a specific point on one wave to the same specific point on the next wave. Using your app, create an image like Figure 1 and Figure 2 above that shows (A) the longest wavelength you can create and (B) the shortest wavelength you can create.
- How did you use your knowledge of wavelengths and experimentation to create these wavelengths? Think about which axis you picked to measure and why you made the specific movements you did in order to create it.
Part 4: Conduct Your Own Seismic Investigation
Now that you’ve familiarized yourself with the app, let’s take an opportunity to conduct an investigation similar to the work the scientists have done with elephants.
- In groups of three, with at least one smartphone with the app above, create your own recordings based on three different actions. Record the resulting graphs using your smartphone or with a sketch in your Student Guide. Designate one person in your group as the record keeper who will keep track of what action goes with which of the recordings.
- When you’ve completed the three actions and sketched or uploaded the graphs in the table below, trade papers or devices with another group to see if they can use their own experimenting and graph analysis to figure out what action generated each seismogram.
- After each group has finished analyzing the graphs and providing their prediction and justification for which activity they think generated each graph, each group record keeper should reveal the real action that generated the graphs!
IMPORTANT: Everyone MUST hold their phone the same way when recording their seismographic data, and they must use the same sensor for measuring their data (x, y, or z). This allows for easier comparison by reducing the number of variables in the type of movement.
- How are these graphs similar to the ones you created using the accelerometer app?
- If you could measure an elephant and a person using the same tool, how would the data look different?
- Look at the image of the geophone recording of the fast walk compared to the bull vocalization. How are they different? How would you try to mimic these elephant behaviors to make a similar waveform in your accelerometer app?
Reflection
Waves definitely can play a pivotal role in our everyday lives and can be used in a variety of new ways.
- Why do you think elephants are organisms that are very effective in this form of seismological study as compared to animals you might see on a more regular basis like a dog or a cat?
- In your opinion, why might it be worth it for a conservation group or protected wildlife area in Africa to invest in the application of this research?
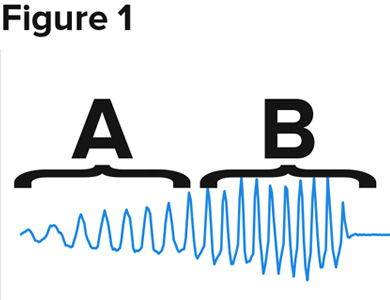
- One of your friends says that section B in Figure 1 from the previous activity shows a long wavelength. Do you agree or disagree with them? Use the template below to help you construct your argument against or in defense of their statement. Use claim, evidence, and reasoning to justify your answer.
- What can a higher amplitude detected in the instance of elephants likely tell us about the source of the waves? Use claim, evidence, and reasoning to justify your answer.
- Say you conducted this study and found that an elephant created waves that had a high amplitude separated by waves with much smaller amplitudes. Can you make an inference about what kind of activity the elephant might have been engaging in? Use claim, evidence, and reasoning to justify your answer. HINT: Look back at your activities as well as the reading from the study by Beth Mortimer and Tarje Nissen-Meyer.
Next Generation Science Standards
Credits
Written by: Marna Eckels and Brian Soash
Editing: Ariel Zych, Johanna Mayer
Digital production: Johanna Mayer, Brian Soash
Educator's Toolbox
Meet the Writers
About Marna Eckels
@MarnaEckelsMarna Eckels is a physics teacher at Dearborn STEM Academy in the Boston Public Schools. Before becoming a teacher, she worked as an engineer on projects ranging from artificial hearts to satellite communication systems. Her proudest moments in the classroom are when students are building engineering projects using their physics knowledge.
About Brian Soash
@BSoashBrian Soash was Science Friday’s educator community leader. He worked to connect educators, schools, and districts with the outstanding educational content being developed by Science Friday.