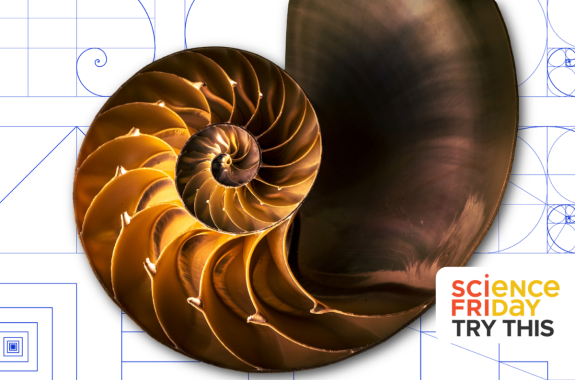
The chambered nautilus has inspired plenty of big clams, we mean, claims! Its coiled shell is commonly pictured alongside the golden ratio, a number associated with spirals, rectangles, art, architecture, and patterns in nature. But placing two similar-looking shapes next to each other isn’t enough to prove a mathematical relationship.
Just as scientists in the video below tested assumptions about whether nautiluses can learn, you can test this shell claim using evidence. In this math activity, you’ll measure images of real nautilus shells, calculate their proportions, and determine whether they really are “golden,” or whether this familiar idea is more myth than math!
What is a golden spiral?
A nautilus begins life with a small shell. As it grows, it adds progressively larger chambers. The animal occupies the newest and largest chamber, while the older chambers help it control buoyancy. This growth creates the shell’s familiar coiled shape.
The shell resembles a logarithmic spiral, a curve that expands while maintaining a similar overall shape. But not every logarithmic spiral is a golden spiral.
A golden spiral is based on the golden ratio, usually represented by the Greek letter phi, or 𝜙.
𝜙 = 1.618
The golden ratio appears when the ratio of a longer measurement to a shorter measurement is approximately 1.618. It is also connected to the Fibonacci sequence, where each number is found by adding the two numbers before it.
1, 1, 2, 3, 5, 8, 13, 21, 34, 55, etc.
As the numbers increase, dividing one Fibonacci number by the number before it produces a result increasingly close to 1.618.
8 / 5 = 1.6
The Fibonacci sequence and golden ratio often appear in nature because they represent an efficient growth pattern, allowing seeds to be packed tightly and leaves to gather as much sunlight as possible. Artist, designer, and Stanford professor John Edmark transforms mathematical patterns into sculptures that appear to bloom endlessly. His 3D-printed blooms have repeated forms that use the golden angle of 137.5 degrees, which is based on the golden ratio. When spun under a strobe light, each flash captures the 137.5-degree turn, creating an illusion that the petals are continuously growing.
“In fact, blooms are a direct descendant of a multi-year-long sequence and explorations on these golden angle, spiral geometry studies.” —Stanford professor John Edmark
Because a nautilus shell expands as it grows, people frequently claim that it forms a perfect golden spiral. However, Christopher Bartlett, an art professor from Towson University, decided to test that assumption. He found that measurements of 80 nautilus shells in the Smithsonian National Museum of Natural History collection showed an average length-to-height ratio of approximately 1.31, not 1.618. That’s a 19% difference! Usually, a 5-10% difference is considered acceptable for experimental results, so his findings cast doubt on the assumption that the nautilus shell follows the golden ratio.
Try This!
An important part of science is being able to reproduce an experiment’s results. So in this activity, you’ll test the results and conclusions from Bartlett’s experiment. By taking careful measurements and using your math skills, you will see if the chambered nautilus’s shell follows the golden ratio.
Materials
- Nautilus measurement worksheet (PDF | DOCX)
- Printed images of several nautilus shells viewed from the side. If working with many students, you may want to laminate the images.
- Metric ruler (or this printable one)
- Pencil
- Calculator
- Colored pencil or marker
- Optional: tracing paper
Find the golden ratio
Calculate each ratio in the table below and round your answer to three decimal places.
| Fibonacci numbers | Ratio | Result |
|---|---|---|
| 2 and 3 | 3 / 2 |
Check1.500 |
| 3 and 5 | 5 / 3 |
Check1.667 |
| 5 and 8 | 8 / 5 |
Check1.600 |
| 8 and 13 | 13 / 8 |
Check1.625 |
| 13 and 21 | 21 / 13 |
Check1.615 |
| 21 and 34 | 34 / 21 |
Check1.619 |
| 34 and 55 | 55 / 34 |
Check1.618 |
What happens to the ratios as the Fibonacci numbers get larger?
Investigate the shells
- Before measuring, examine each shell image. Predict whether the ratio of its length and height will be close to the golden ratio, 1.618.
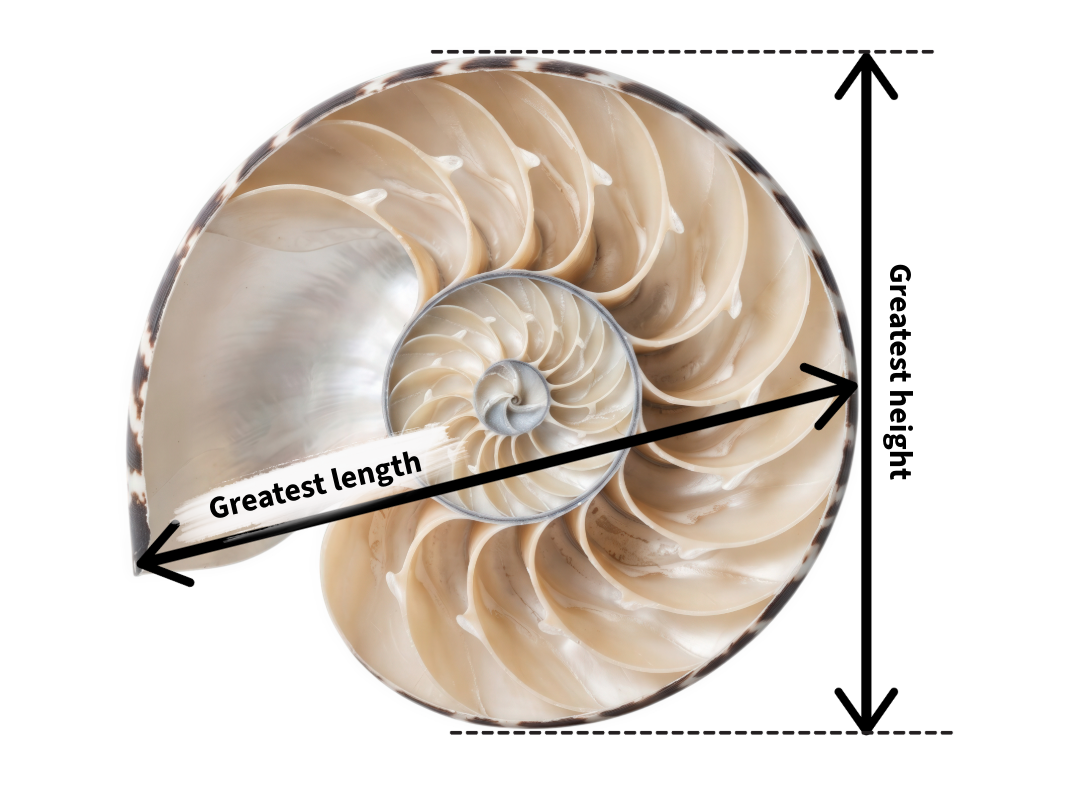
- Measure the shell’s greatest length from front to back. Record the measurement in millimeters.
- Measure the shell’s greatest height in millimeters from top to bottom. Record the measurement in millimeters.
- Divide the length by the height:
Shell ratio = length / height
- Repeat the process for each shell image.
- Calculate the mean of the ratios for all the shells:
Mean = sum of the shell ratios / number of shells
- Calculate the absolute value of the difference between your mean measured ratio and the golden ratio:
Difference = ꘡ shell ratio ﹣ 1.618 |
| Nautilus shell | Length (mm) | Height (mm) | Length / height | Difference from 1.618 |
|---|---|---|---|---|
| A |
Check180 |
Check160 |
Check1.125 |
Check0.493 |
| B |
Check194 |
Check141 |
Check1.376 |
Check0.242 |
| C |
Check186 |
Check135 |
Check1.378 |
Check0.240 |
| D |
Check185 |
Check130 |
Check1.423 |
Check0.195 |
| E |
Check200 |
Check171 |
Check1.170 |
Check0.448 |
| MEAN |
Check1.294 |
Check0.324 |
Note: The listed length and height may vary slightly from yours, depending on your ruler, printer, etc. As a result, your calculated mean and differences may vary as well. These results are provided as examples.
Issue your myth verdict!
Use your measurements to complete one of these statements:
- Our evidence supports the claim that nautilus shells have golden proportions because…
- Our evidence does not support the claim because…
- Our results are inconclusive because…
Support your verdict with at least two pieces of numerical evidence.
Questions to ask yourself
- Did every shell have the same ratio? Why might real shells vary?
- Was your mean closer to 1.618 or 1.31?
- How could cropping, image angle, or measurement error affect your results?
- How many shells would you need to measure before feeling confident in your conclusion? Explain your reasoning.
- What is the difference between finding a pattern and proving that the pattern exists?
- Can two shapes look similar without having the same mathematical proportions?
Extension activities
Love math? So do we! Here are more ways to use the data you collected or continue your investigation.
Calculate the percent difference
The percent difference (or percentage difference) compares two ratios of similar things. For example, Bartlett found the percent difference between his calculated ratio of nautilus shell length to height (1.31) and the golden ratio (1.618) was 19%. Using the data from your experiment, calculate the percent difference between your calculated mean ratio and the golden ratio.
Percent difference = (꘡ mean ﹣ 1.618 ꘡ / 1.618) x 100
Then use the same formula to calculate the percent difference between your calculated mean and Bartlett’s proposed ratio of 1.31. (Hint: Replace 1.618 with 1.31 in the formula above.) Based on the evidence you collected, which ratio is more accurate for nautilus shells, Bartlett’s ratio or the golden ratio? Explain your reasoning.
Take it further
Measure twice. Have two people independently measure the same shell. Compare their results and calculate the range. If there were differences, what may have caused them?
Test the spiral directly. Mark the shell’s center and measure from the center to the spiral at equal turning intervals. Compare consecutive measurements. A true golden spiral increases by a factor of approximately 1.618 every quarter turn.
Create a golden comparison. Construct a golden rectangle with a length-to-height ratio of 1.618. Place it over a shell image using tracing paper or acetate. Where do the shapes align, and where do they separate?
Compare species. Measure other coiled shells, such as snails or conchs. Do different species produce similar ratios, or does each have its own pattern of growth?
Why are scientists studying the nautilus?
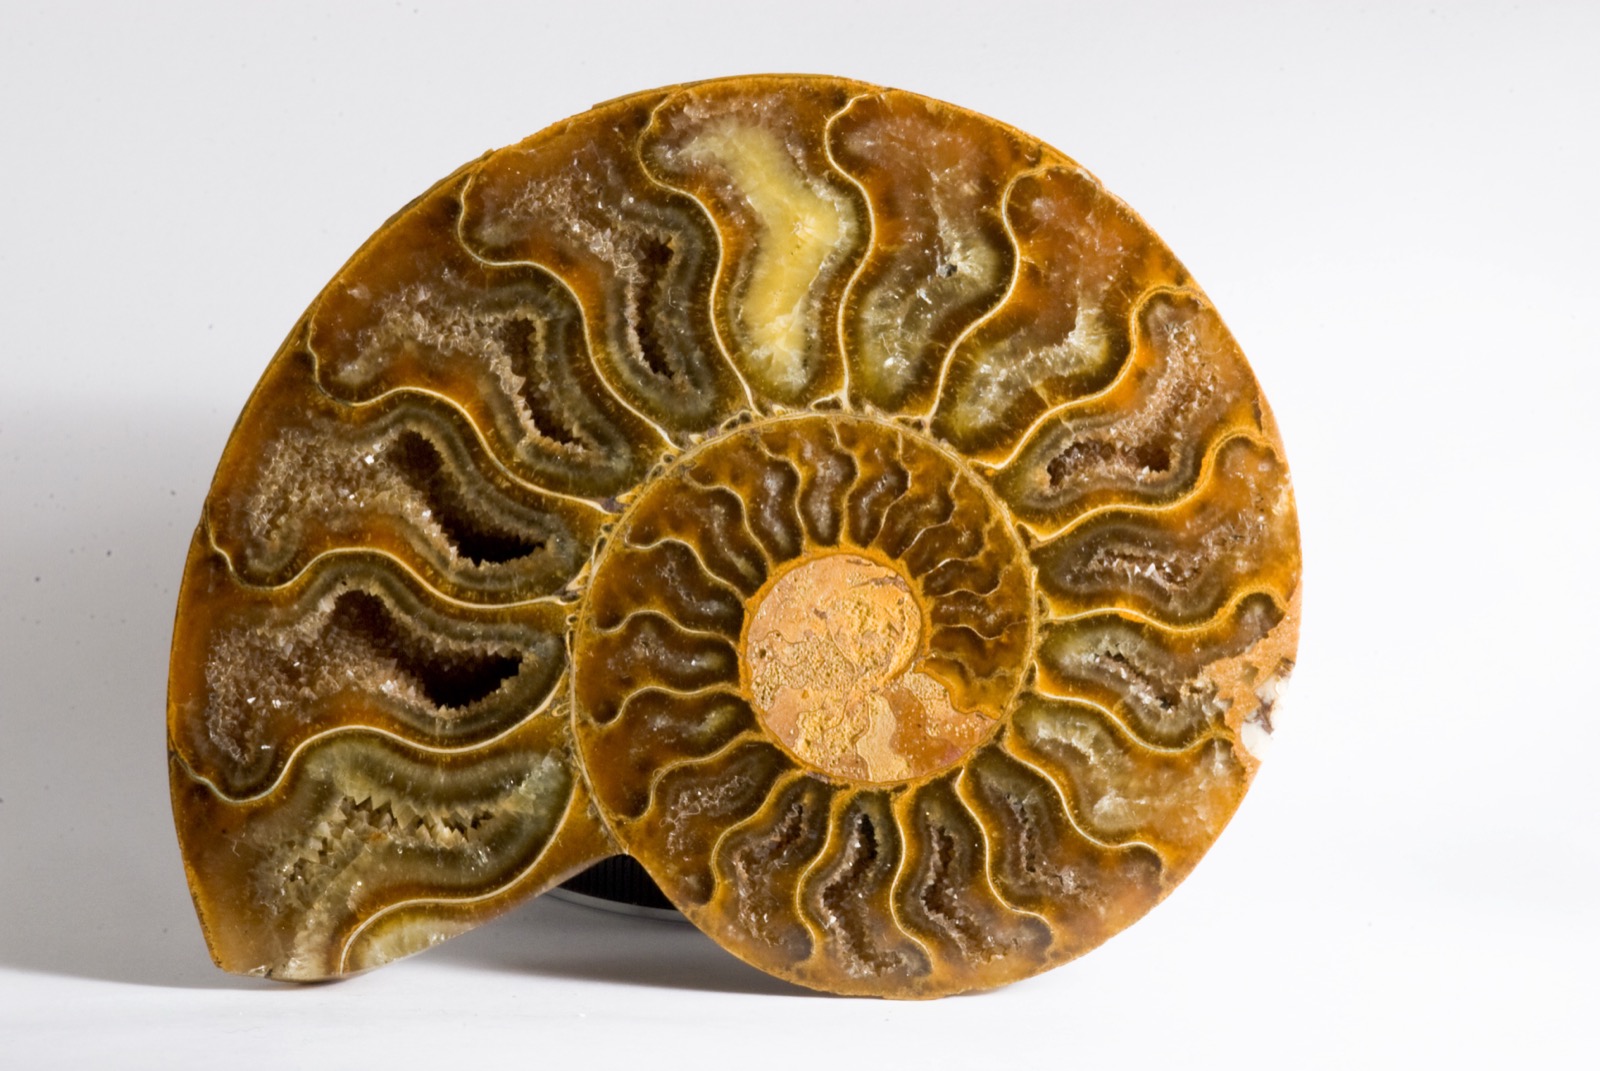
Scientists are interested because the nautilus shell is a record of biological growth. As the animal grows, it builds progressively larger chambers while maintaining a similar overall shape. Measuring those chambers helps researchers investigate how growth patterns develop, how shell geometry affects protection and buoyancy, and how living nautiluses compare with extinct shelled cephalopods.
The golden-ratio claim is also a useful test of scientific thinking. A shell may resemble a mathematical spiral without matching it precisely. Comparing measurements with a mathematical model helps scientists distinguish an appealing visual pattern from one actually supported by evidence. By testing this claim yourself, you see how math can help you question assumptions, evaluate evidence, and figure out whether something that looks convincing is really true.
Keep learning
- Explore more ways the Fibonacci sequence shows up in nature and how it’s related to evolution with “Fibonacci Sequence—A Handy Mathematical Approach For Looking At Evolution!”
- Discover more about the chambered nautilus and learn why it’s endangered at Save the Nautilus.
- Play Endangered Rescue: Chambered Nautilus, a special-edition escape room card game from Grand Gamers Guild where you’ll play a science journalist hosting an event about this amazing cephalopod.
- Read “Three Hearts: An Anthology of Cephalopod Poetry” or write your own ode to an octopus!
- Read about the “Ocean Through Time” from the Smithsonian Institution.
Standards
NGSS
Practice 4: Analyzing and Interpreting Data – Once collected, data must be presented in a form that can reveal any patterns and relationships and that allows results to be communicated to others.
- MS – Analyze displays of data to identify linear and nonlinear relationships.
- HS – Apply concepts of statistics and probability (including determining function fits to data, slope, intercept, and correlation coefficient for linear fits) to scientific and engineering questions and problems, using digital tools when feasible.
CCSS
- CCSS.MATH.CONTENT.6.RP.A – Understand ratio concepts and use ratio reasoning to solve problems.
- CCSS.MATH.CONTENT.7.RP.A – Analyze proportional relationships and use them to solve real-world and mathematical problems.
- CCSS.MATH.CONTENT.6.SP.A – Develop understanding of statistical variability.
- CCSS.MATH.CONTENT.7.SP.A – Use random sampling to draw inferences about a population.
- CCSS.Math.Content.HSF.IF.A.3 – Recognize that sequences are functions, sometimes defined recursively, whose domain is a subset of the integers.
- CCSS.MATH.CONTENT.HSN.Q.A.3 – Choose a level of accuracy appropriate to limitations on measurement when reporting quantities.
- CCSS.MATH.CONTENT.HSS.IC.A.2 – Decide if a specified model is consistent with results from a given data-generating process, e.g., using simulation.
Credits:
Lesson by Cybele Tamulonis
Copyediting by Erica Williams
Developmental editing by Sandy Roberts
Digital production by Sandy Roberts
Educator's Toolbox
Meet the Writer
About Cybele Tamulonis
Cybele Tamulonis is a writer, apiarist, and entomology enthusiast.