Grade Level
6 - 8
minutes
60-90 minutes
subject
Earth Science
Activity Type:
math activity, making models, Simulation
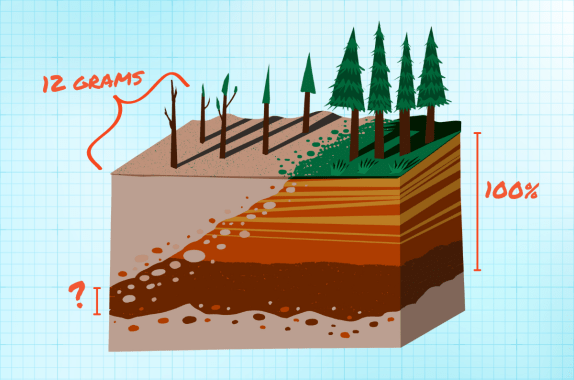
Our environment is struggling, and many places do not have land to support plant growth. That’s a challenge for China, where only 12% of the soil is arable—capable of supporting plant life. Over many years, drought, deforestation, and climate change have led to desertification and the loss of fertile land.
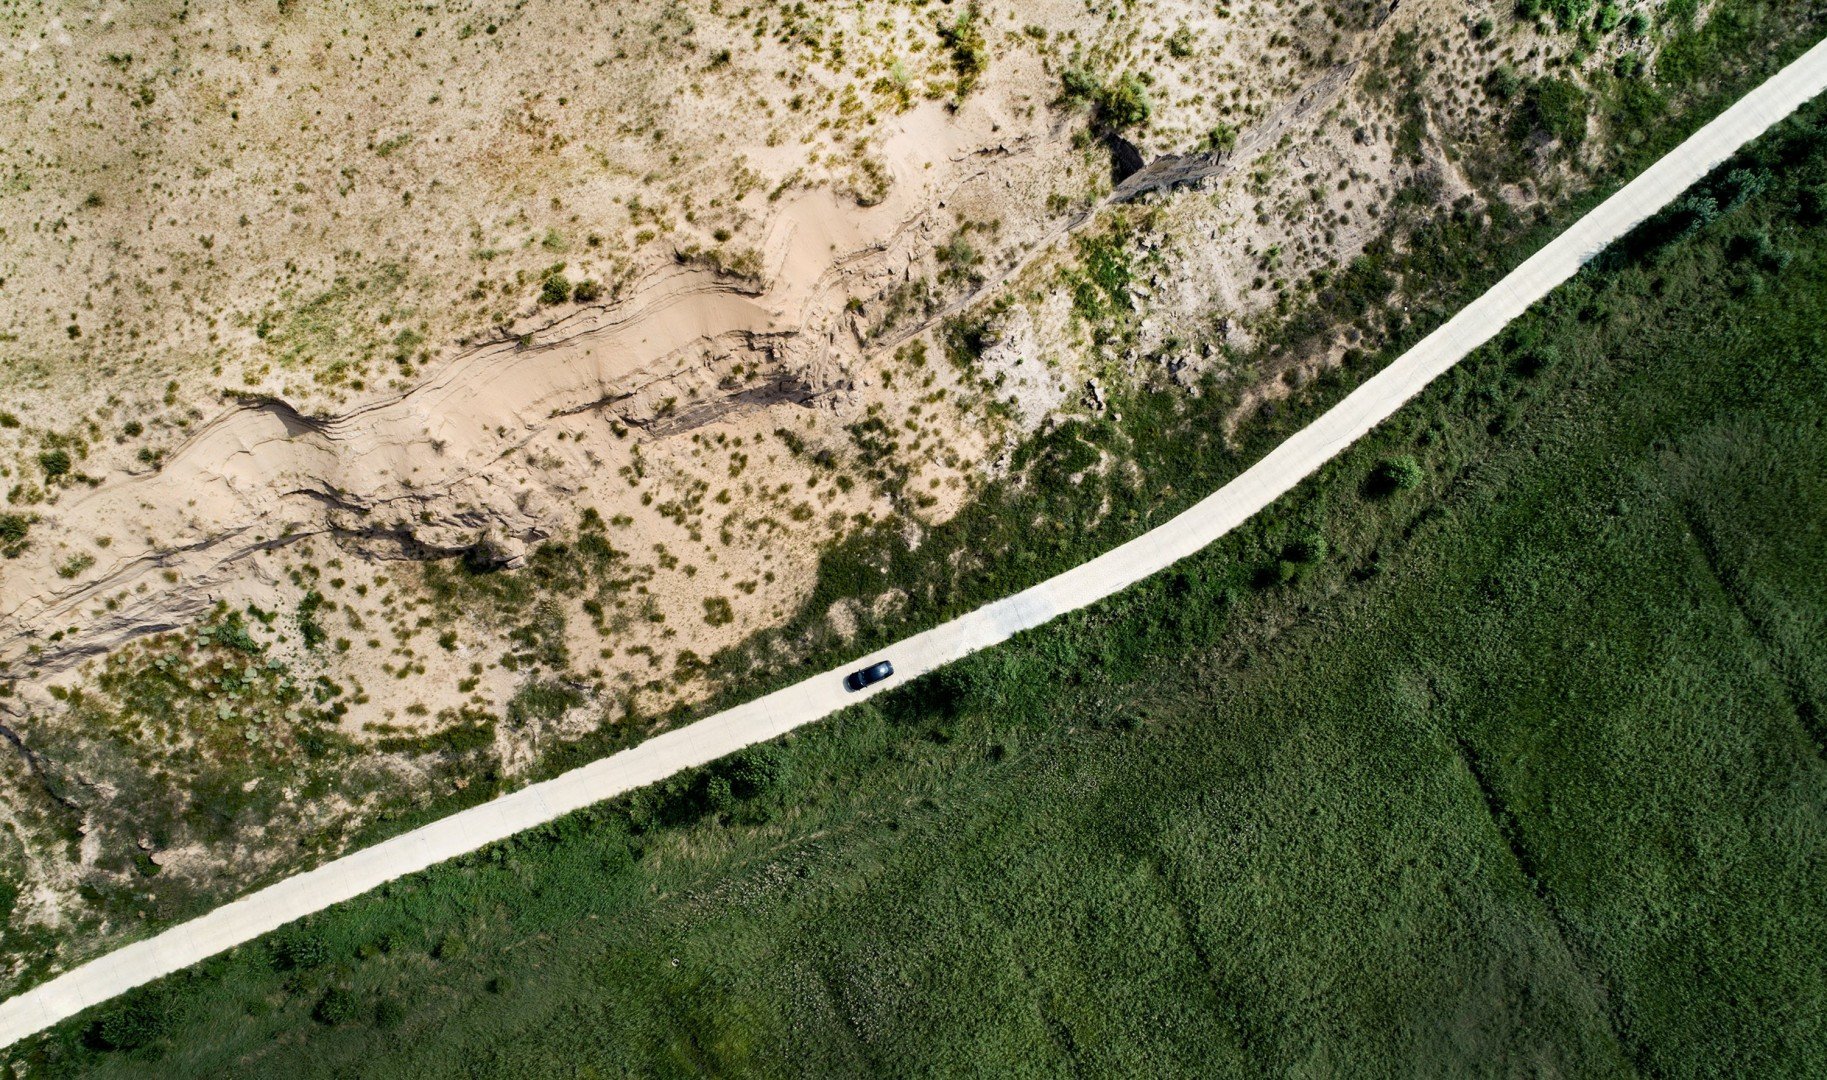
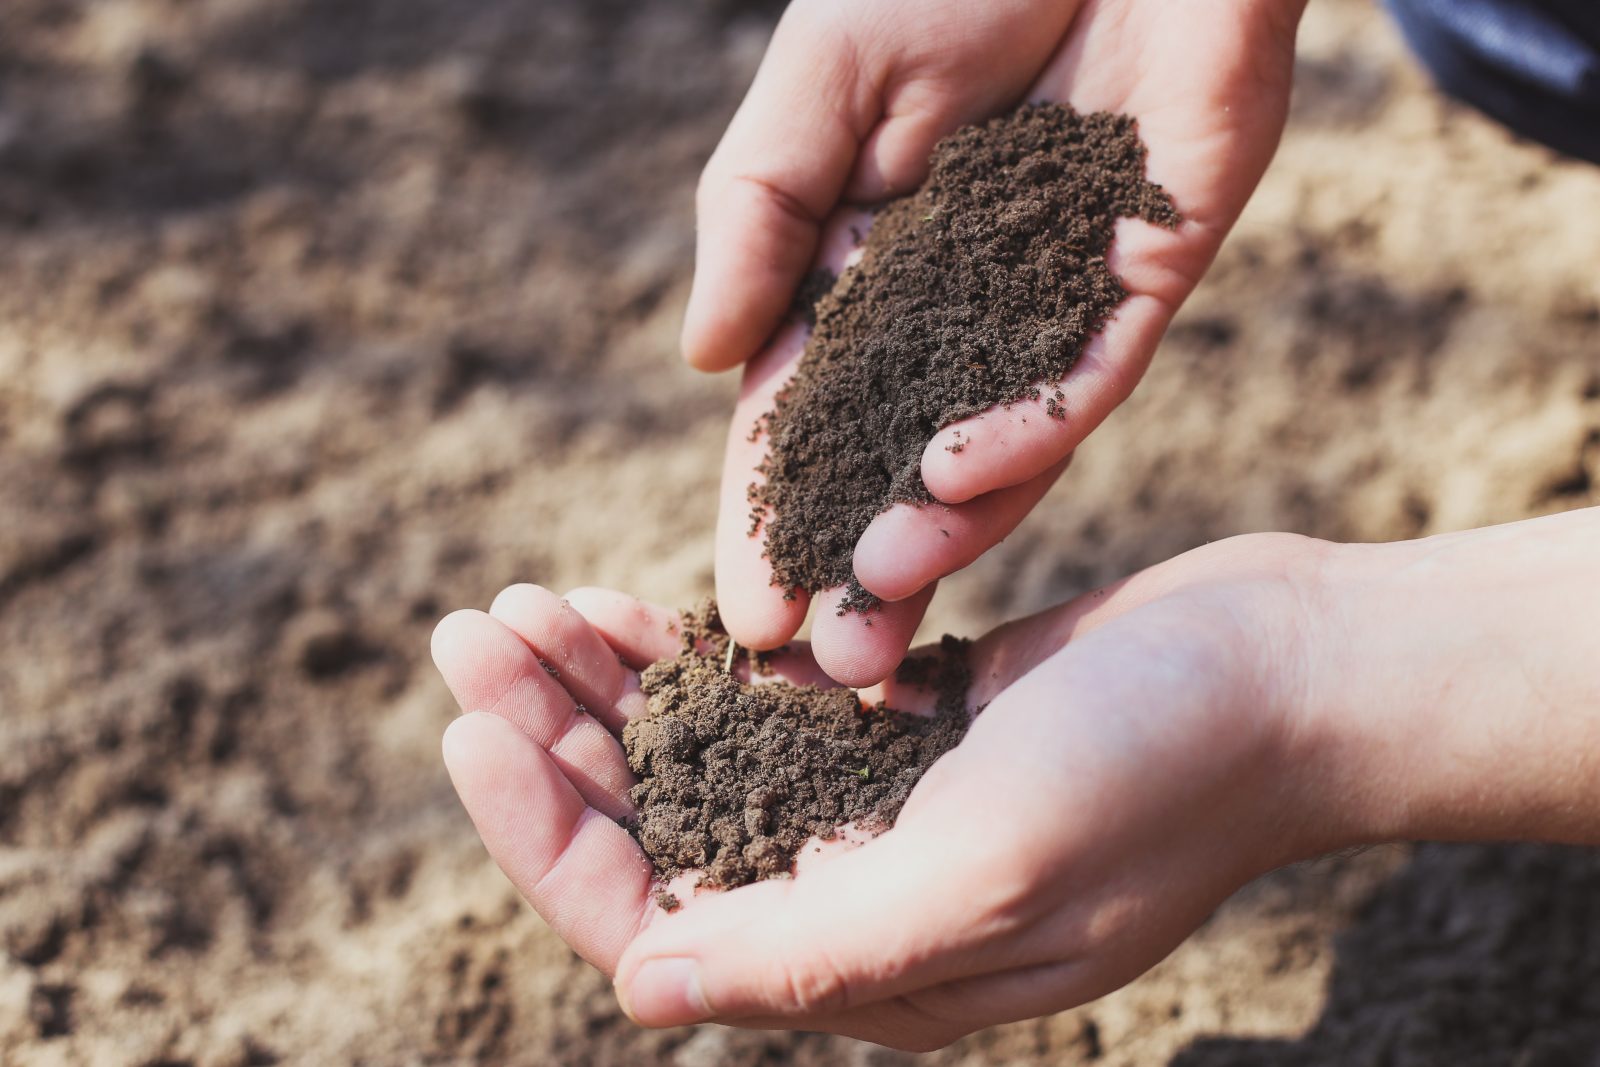
Take a look at the photo above. Ask yourself these questions:
- What is needed for plants to grow?
- How might you select which plants would be best to reforest a desert?
- How long do you think it might take to go from a desert to a forest?
- What positive and negative effects do you think having vegetation has on a region that was formerly a desert?
For over 40 years, China has worked on projects such as reforestation to push back against its expanding desert regions by planting trees. Now, scientists have another promising idea: They are adding organic matter to the soil to increase the minerals, nutrients, air, and microbes essential for plant growth. Using this method of amending the soil for a decade, researchers transformed a section of sandy desert into cropland that could grow rice, watermelon, and sunflowers. How did they do it?
Hint: It’s The Soil
Some countries, such as China, are taking drastic measures to convert desert areas to support plant life. But in order to accomplish such an ecological feat, they have to start from the ground up. That’s right! They have to start by changing the soil.
Many environmental factors affect the growth of plants, one of which is soil quality. Soil provides nutrients to the plants and encourages root formation to keep plants in place. Water is also necessary for plant growth and helps retain moisture, which plants absorb over time. Soil is composed of many materials, including organic matter, sand, clay, humus, perlite, and vermiculite. The amount of each of these materials affects how much water is either drained from or absorbed by the soil.
In this activity, you will analyze different soil types to determine their composition and properties. Then you’ll apply that knowledge to choose the appropriate soil for specific plants. As you go about engineering soils, you’ll learn to use ratios and percentages to accurately describe the relative amount of each component in the soil mixture so that other scientists can replicate your results.
The Building Blocks Of Soil
For soil to be arable, it needs at least two things: drainage and aeration. Drainage allows excess water to be removed from the soil and prevents root rot. Aeration makes space for air in the soil and keeps the soil from compacting and becoming too hard. The amount and type of different components present in the soil affect drainage and aeration.
 |
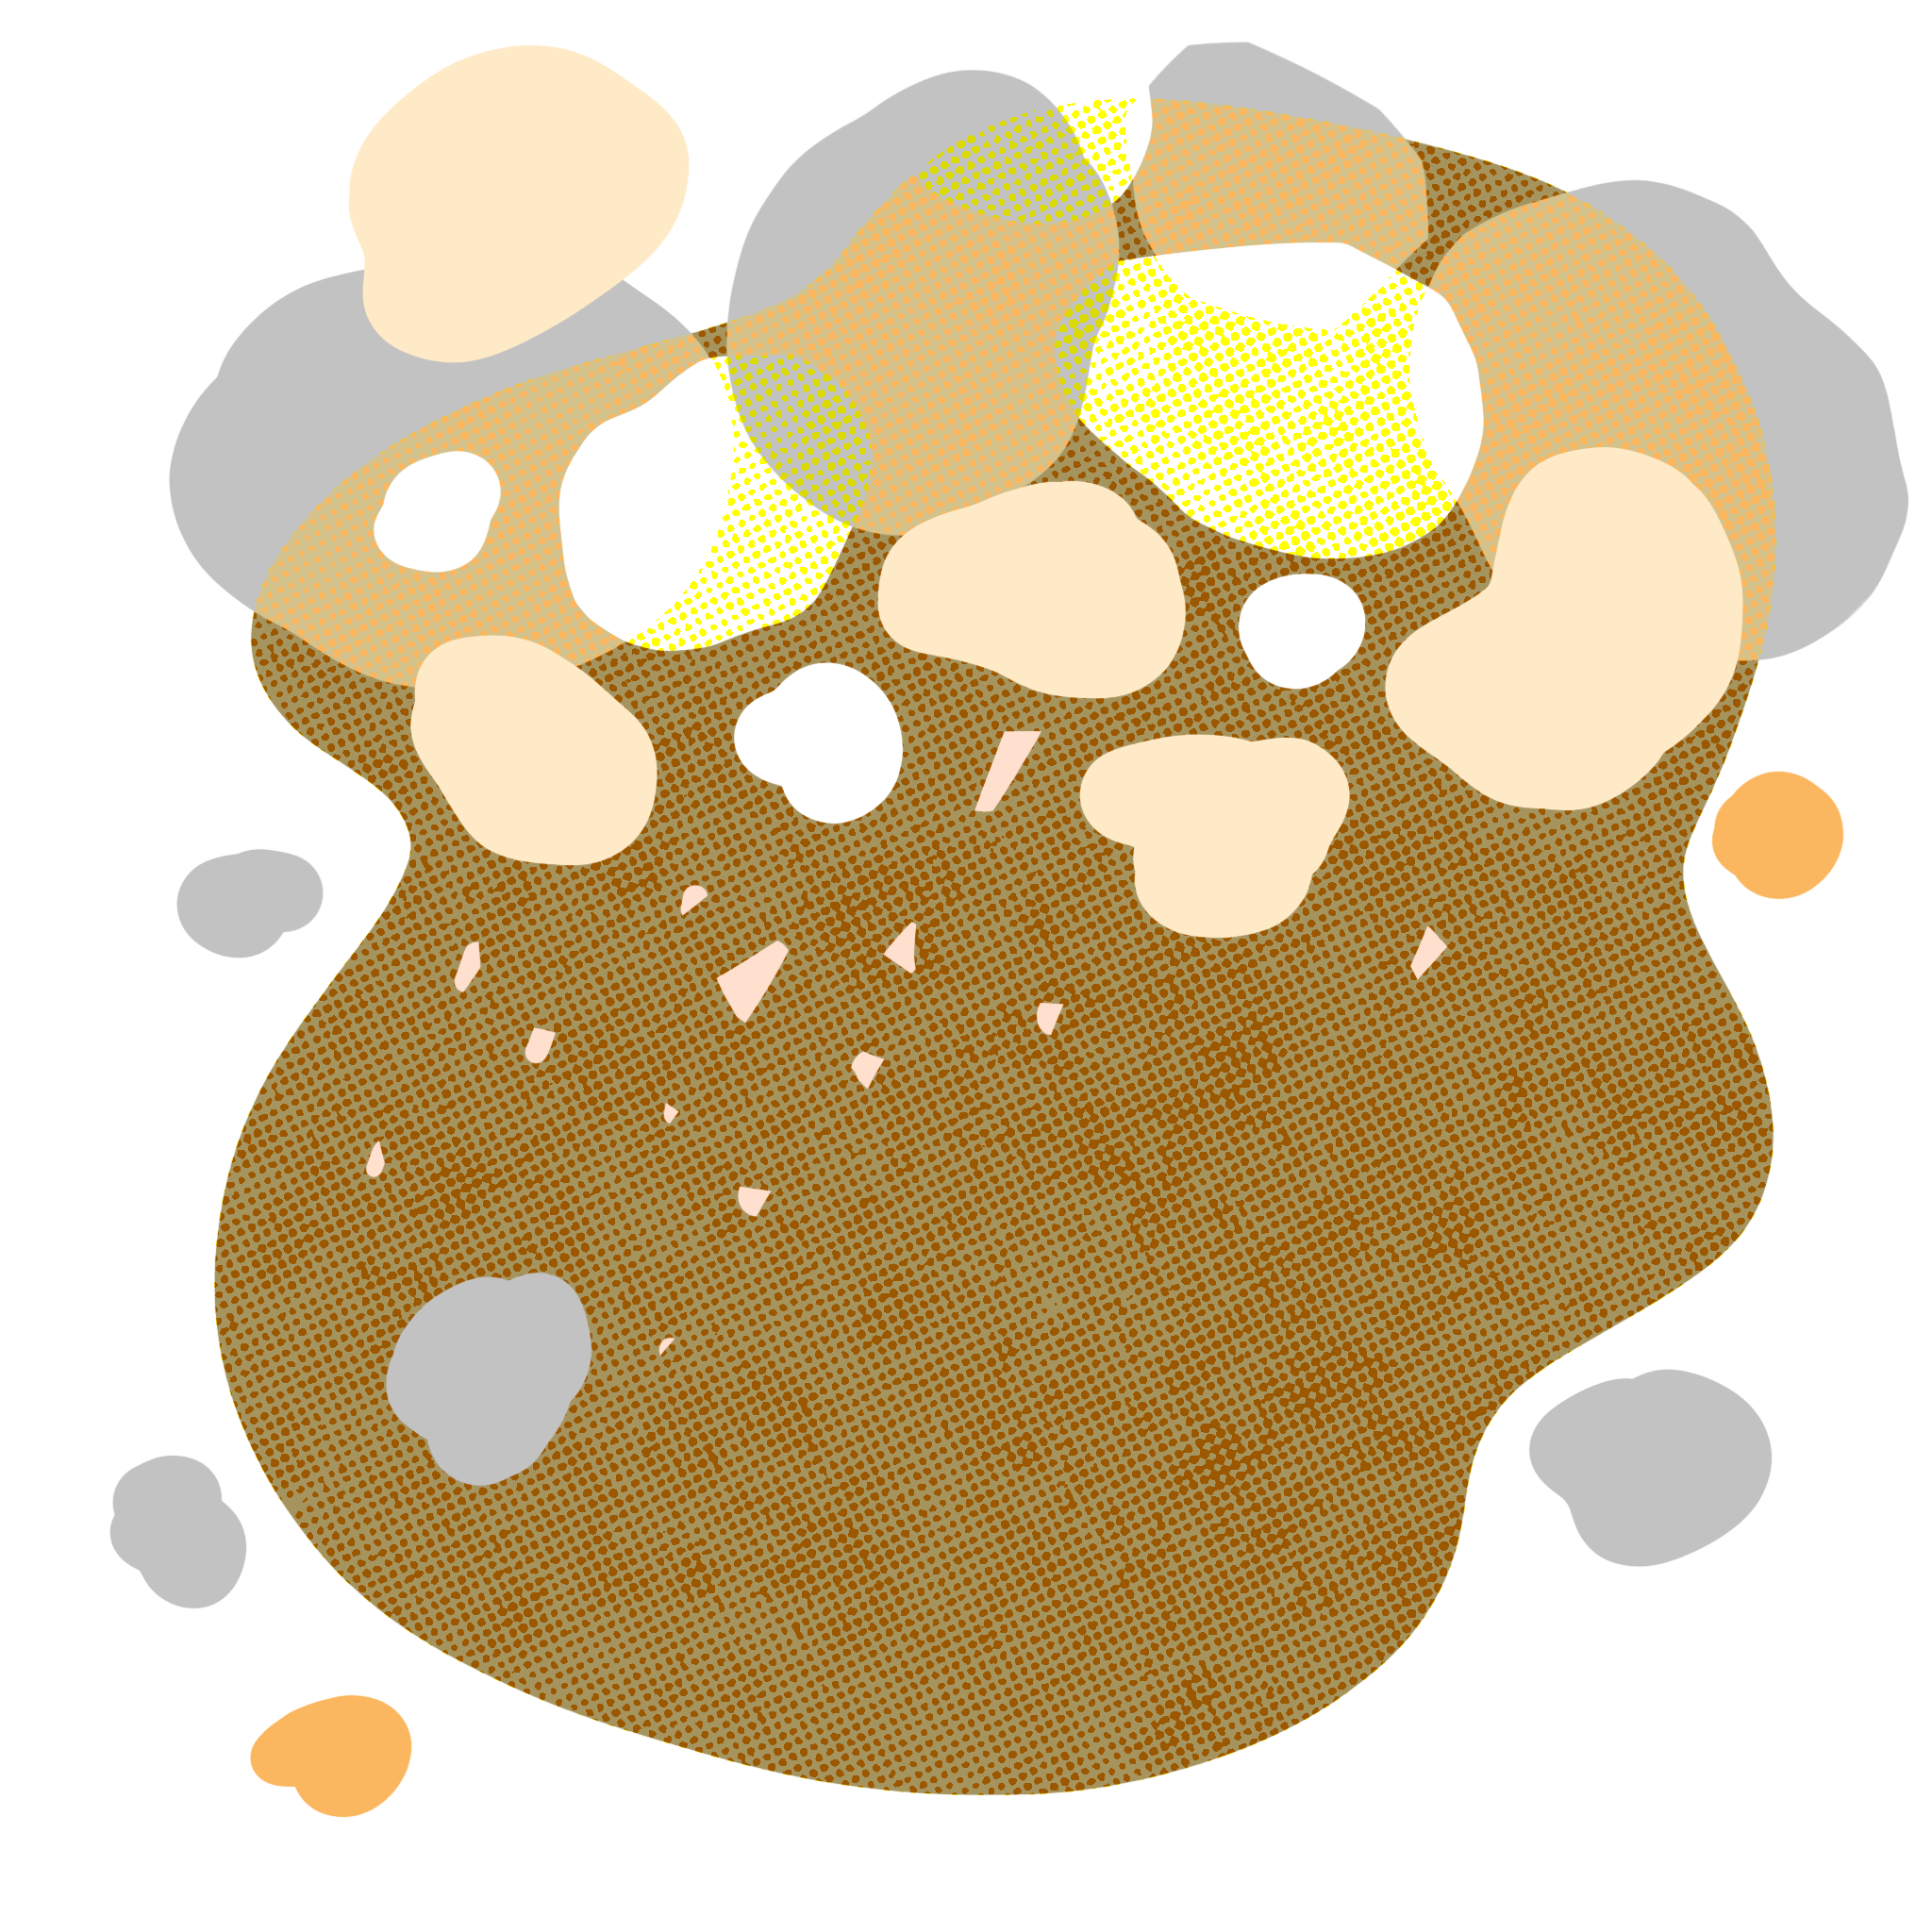
Sand promotes drainage and aeration, allowing water and air to flow through the soil. Depending on the amount and coarseness of the sand, it will allow more or less water to pass through the soil. Sand also helps soften the soil. |
 |
Humus is made of living things that have decomposed. These could be a mix of things, such as plants or animals, which have died and decayed to the point where they can’t break down further. This soil component carries many nutrients that plants need to grow. Compost may be used as humus in a soil mixture. |
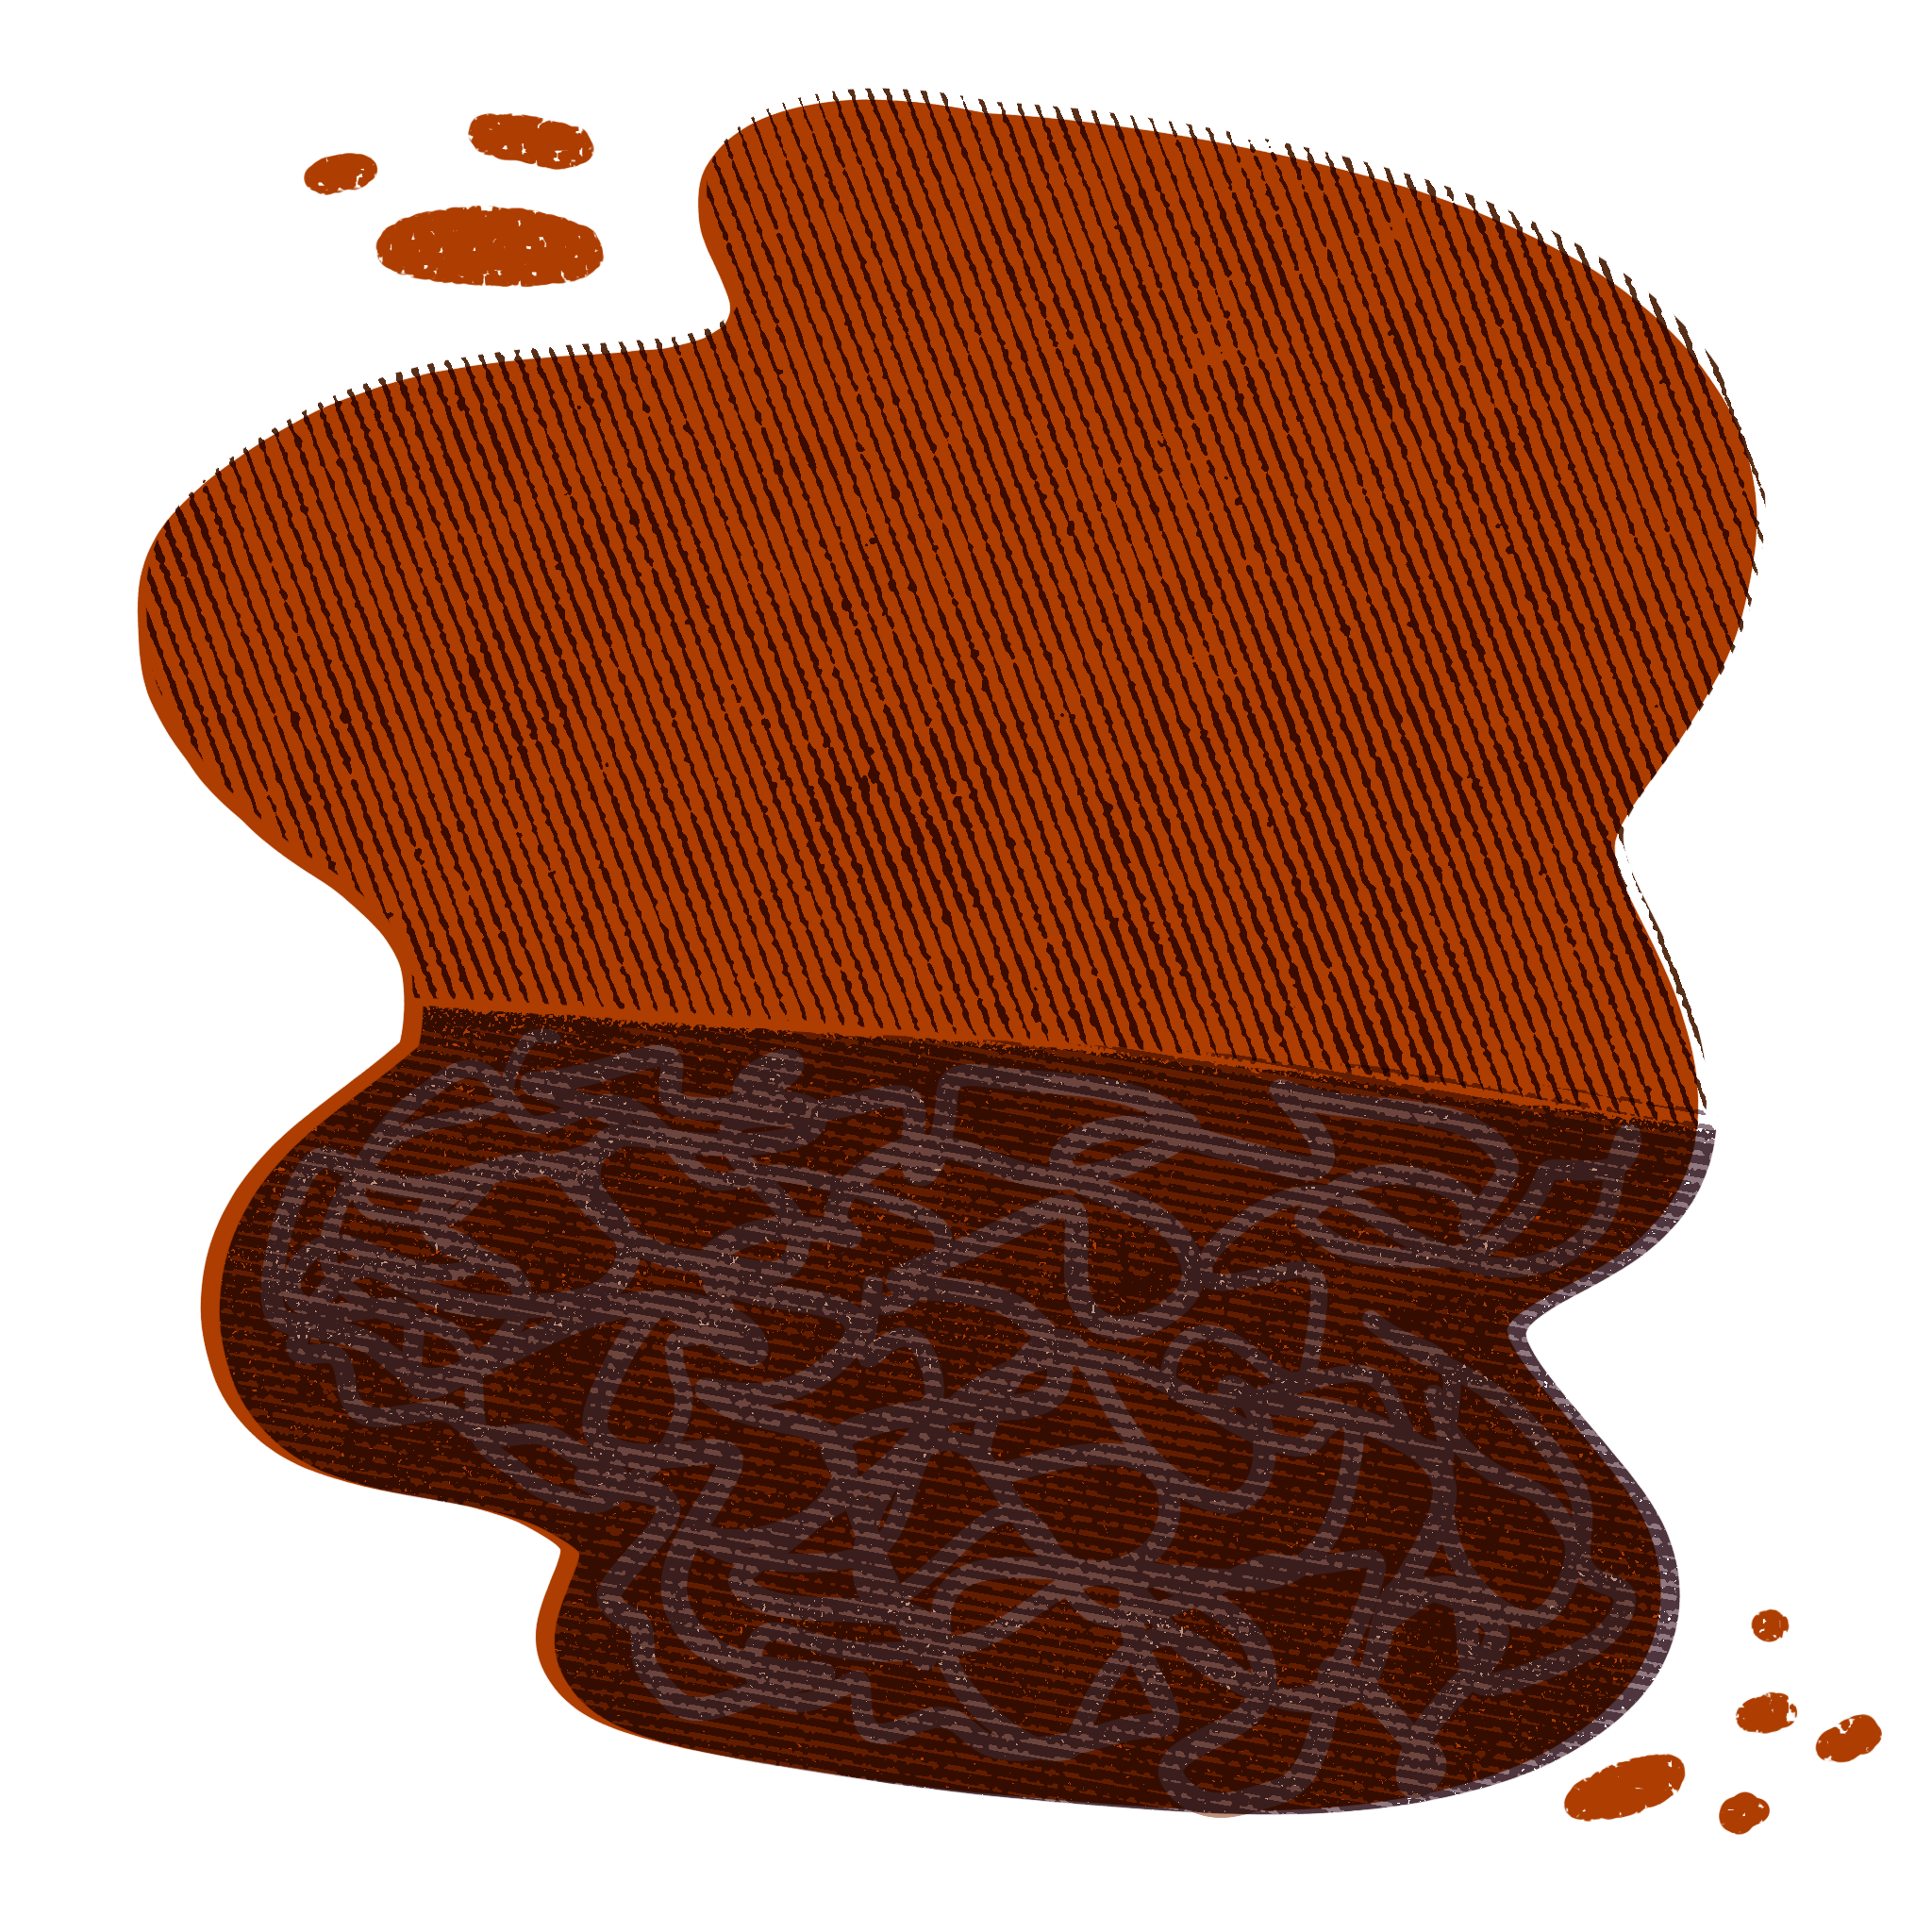 |
Organic matter is made of plant-based materials that decay and break down over time once added to soil, releasing nutrients into the soil and allowing it to retain moisture. The most commonly used organic matter is sphagnum peat moss or pine bark. |
 |
Perlite or vermiculite improves drainage in the soil. These additives remove excess water from the soil and prevent root rot. Perlite is puffed-up pieces of volcanic glass that provide space for water to flow. Vermiculite is an expanded mineral that looks like small rocks, which allow less water to flow through the soil. Both stop soil from compacting and becoming a solid mass. |
Packaged soil you buy at the store has different percentages of these soil components based on the plants the soil is made to support and grow. Packaged soil may also be labeled as topsoil or loam. Topsoil is what it sounds like—the top layer of soil, usually 4 to 12 inches thick. Loam is a type of topsoil with a perfect balance of components for growing most plants. Farmers work to have very rich, loamy topsoil that benefits plants.
Activity 1: Soil Analysis Comparison
It is time to get to know your soils. Each mystery soil sample prepared by your teacher is in a small container labeled with a sample number. You’ll need to analyze the look and feel of each sample, make a hypothesis about what components are in the soil, and draw conclusions about the type of plant for which the soil is best suited.
Materials
- Small containers to hold soil samples with a sample of each of the following for each group.
- Sample 1: Miracle Grow Potting Mix or similar soil mix
- Sample 2: Miracle Grow Garden Soil or similar soil mix
- Sample 3: Miracle Grow Tropical Potting Mix or similar soil mix
- Sample 4: Optional soil from your area if drastically different from above
- Soil Composition Worksheet
- Magnifying glasses (optional)
- Water and droppers (optional)
Important notes for educators: When purchasing soil, check the back of the package to ensure the composition is listed. You may need to contact the manufacturer or visit the company website for ingredient details. You can also perform a jar soil test in advance to determine the percentage of components.
Alternatively, you may buy individual components such as sand, humus, compost, or perlite to mix your own standardized soil samples. Most potting soils are combinations of pine bark, sphagnum peat moss, perlite, and vermiculite. Tropical potting soils need maximum aeration and drainage to support their plants successfully, so they contain additional sphagnum moss and materials like coco coir. Potting mixes are usually “soilless,” meaning they don’t include humus, which reduces the chances of pests and diseases accidentally being part of the mix. It also reduces nutrients. As a result, there is often an artificial fertilizer added. Garden soil or container mixes often include organic matter, topsoil, and humus or compost.
You may also want to provide “touch samples” of individual components for students to examine.
Safety Note: You should always wash your hands after handling soil samples and avoid contact with eyes.
Observe Your Soil Samples
Carefully observe each soil sample using your sight, touch, and smell. Answer the following questions for each soil sample.
- What color is the soil? Is it light or dark? Why do you think it is this color?
- Does the soil seem sandy? Is the soil very solid or soft?
- Are there pieces in the soil? What are the pieces made up of?
- If you put water in the soil, do you think it would absorb the water, or would it flow through the soil easily?
Record your observations on your Soil Composition Worksheet.
Next, refer to the plants shown on the worksheet. Each has specific needs. Predict which soil sample would be best for each plant based on your observations and what you have learned about sand, humus, organic matter, and perlite or vermiculite. Give your reasoning for matching each plant with a soil sample on your worksheet.
Activity 2: Soil Percentages And Ratios
You’ve made qualitative observations using your senses to describe the look and feel of your soil samples. However, scientists often use quantitative observations using measurements and numerical data to provide highly accurate descriptions. You will use provided information about the soil composition and sample mass to make quantitative observations.
Materials
- Composition information about your soil sample from your teacher
- Paper and pencils (or whiteboard and markers)
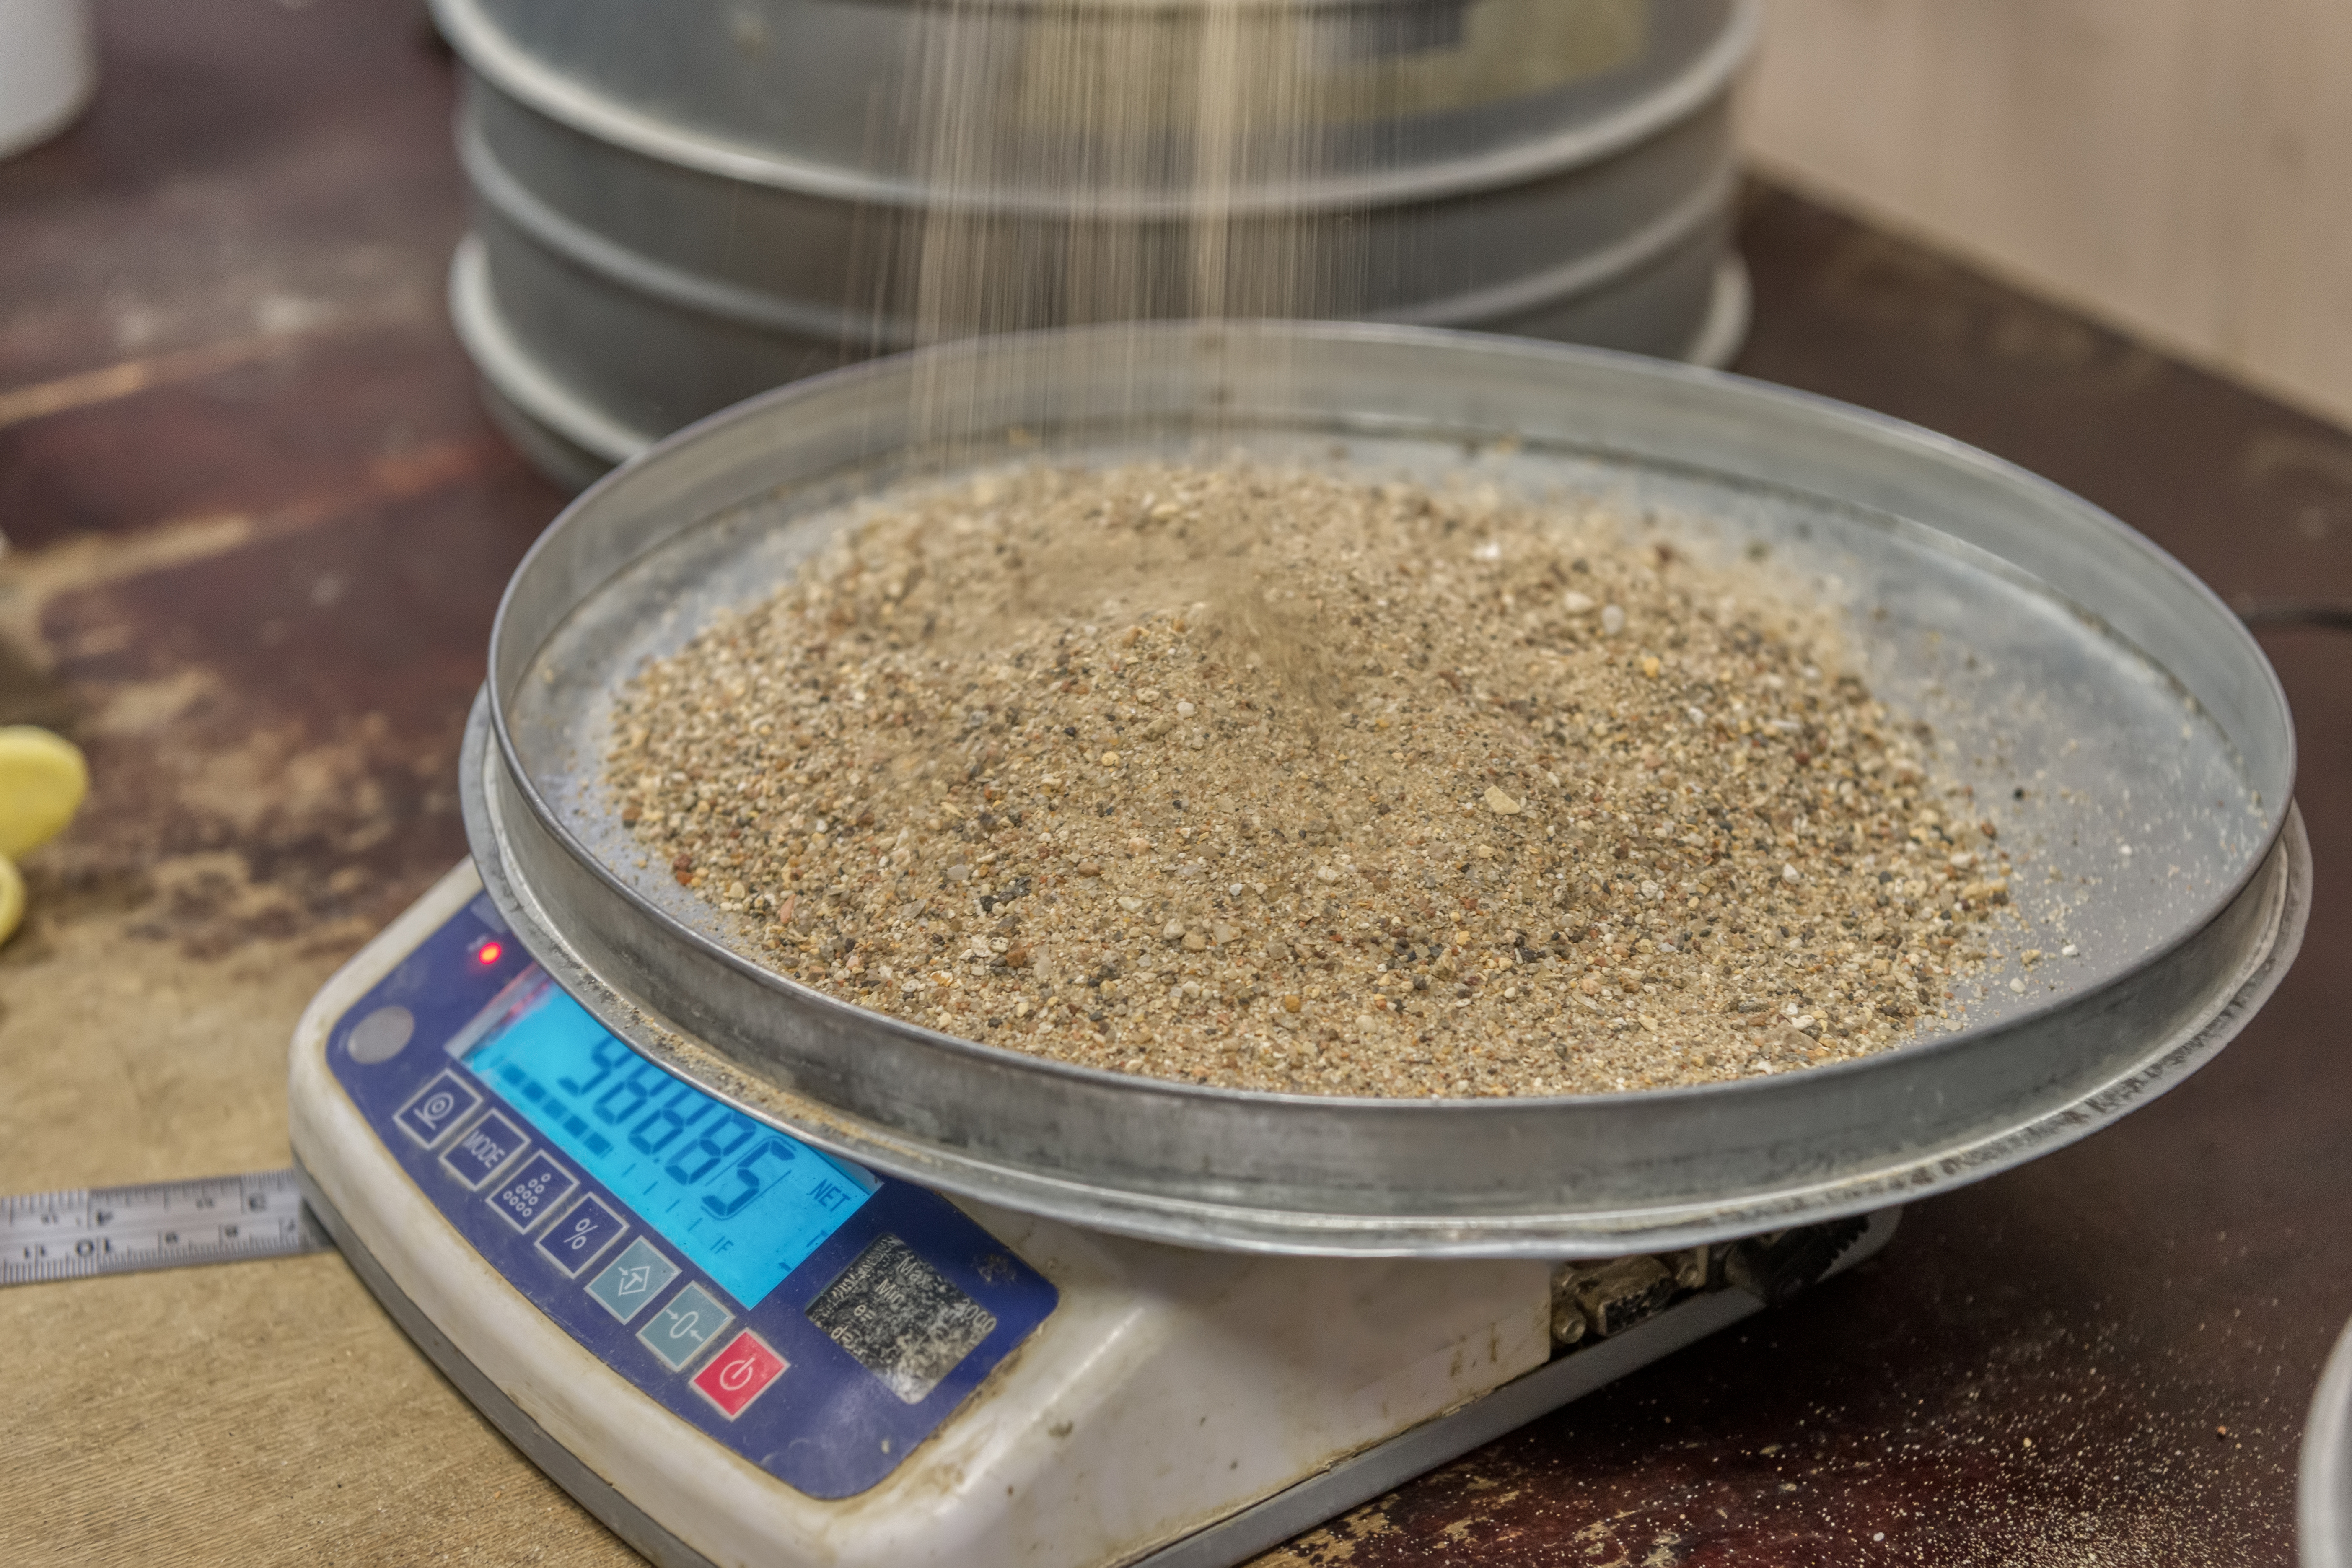
- Balance to accurately measure the mass of each soil sample
- Soil Composition Worksheet
Analyze Your Soil Composition
Select a soil sample you want to analyze. Using the sheet provided, determine the sample composition by percentage per component and the mass of the soil sample. Using this information, you need to calculate the mass of each component in the sample. How many grams of each material was added to the sample to create the soil?
A percent is the number of something per 100. It’s part of a whole. When you add up the percentages representing all the parts of the whole, they should equal 100.
Suppose you have 10 grams of a soil sample with a composition of 50% sphagnum moss, 30% shredded pine bark, and 20% perlite. You can use ratios and proportions to determine how many grams of each ingredient is in the soil sample.
Using Ratios And Proportions
Start by setting up your percentage as a ratio. Place the part over the whole. In other words, put the percent number over the number 100. For the sphagnum moss component, it should look like this:
50
100
Next, you’ll create your proportion. Again, you’ll set the part over the whole. In this case, you don’t know what the part is. So you’ll use an unknown variable to stand in for now. You’ll call that amount “x.” (You can use whatever letter you’d like.) Our whole is the mass of the soil sample—10 grams. So you’ll write that proportion like this:
x
10
Now you’ll make your proportion by setting these two ratios equal.
50 = x
100 10
Now for the best part! You get to cross multiple and solve for your unknown value.
50 * 10 = 100 * x
500 = 100x
100 100
5 = x
There are 5 grams of sphagnum moss in our soil sample! Now try using the same method to determine how much pine bark and perlite are in the sample.
There are 3 grams of pine bark and 2 grams of perlite. Add together all the parts you calculated. They should equal the whole. In this case 5 + 3 + 2 = 10 grams.
Repeat Your Calculations For Each Soil Sample
Use the same method to determine each component’s mass in your soil sample. Compare your results with your classmates. Working together, come to a consensus on the composition of each soil sample.
Refer back to your worksheet. Look at what soil sample you thought would be best for each plant. Now that you know the exact composition of each soil, do you still think your predictions are accurate? How does this additional evidence support or weaken your claim?
Activity 3: Simulating Soil With Cereal
Now that you know how to calculate the composition from a percentage, why not work backward? In this activity, you’ll use a model of soil. A model represents a real thing and is often used to understand the original better. It may be smaller or larger, like a globe representing the Earth or a blown-up drawing of the parts of a tiny cell. Often the model is made from a different material as well.
In this case, you’ll be using cereal as your soil model. The mystery cereal model will correspond with one soil sample from the previous activity. Can you match them correctly?

Materials
- Large plastic bin
- Soil model made of four different and easily identifiable cereals (approximately two boxes of each type for each class)
- A disposable cup to collect the sample
- A paper plate with a rim for analyzing the sample
- Soil Composition Worksheet
Educator Safety Note: Assess student allergies in advance and select cereals appropriately. If needed, try other nonfood items like beads and marbles.
Analyze Your Cereal Sample
In the previous activity, you were given the percentages of each component of the soil and determined the mass of each item within the mix. Here, you will determine the percentages of each component by directly counting the pieces of cereal.
Start by analyzing your cereal sample:
- Retrieve a cup of your soil model from your teacher.
- Spread the cereal on your plate.
- Count how many overall pieces of cereal there are.
- Sort each type of cereal into a pile.
- Count how many pieces you have for each kind of cereal.
- Record this information on your worksheet.
Now, you can use this information to calculate the percentages of each component in the cereal soil. For this example, pretend we had 155 pieces of cereal in total. There were 73 pieces of cinnamon sugar cereal, 41 pieces of toasted oats, 24 pieces of fruit-flavored loops, and 17 pieces of wheat squares. Time to set up your ratios.
Use Ratios To Calculate Percentages
Just like before, you’ll set the part over the whole. So for the cinnamon sugar cereal, you’ll create a ratio like this:
73
155
This time the percentage is unknown. Since a percent is always a part of 100, you will use that to create your ratio.
x
100
Now you will create a proportion and cross multiply just like last time.
73 = x
155 100
73 * 100 = 155 * x
7300 = 155x
155 155
47% = x
If you do the same thing for each type of cereal, you’ll find 26% toasted oats, 15% fruit-flavored loops, and 11% wheat squares. Again, we’ll check our results by adding up all the percentages. Do they equal 100?
This process is not the only way to determine the percentage of each type of cereal. An alternative method is to divide the number of cinnamon sugar cereal pieces by the total number of cereal pieces, then multiply by 100. Learn more about converting fractions to decimals and percentages.
Relate Your Cereal Soil To Real Soil
Imagine that one of your soil samples from the previous activity was a pre-packaged garden soil mix with 50% pine bark, 25% sphagnum moss, 15% compost, and 10% perlite. Is that a good match for your cereal model? Why or why not?
Analyze your cereal model soil using the same method. When you have calculated the percent of each component, compare it against the information from the previous activity’s soil samples. Record the information on your worksheet.
- What soil sample is represented by the cereal model? What is your reasoning?
- What soil component does each cereal type represent? How do you know?
Select one of the other soil samples. Write the 100-piece cereal model recipe for that soil.
Extension: Put It All Together
Now go back to the challenge that Chinese scientists are facing. They want to make dry, sandy deserts into arable land to grow crops. Some crops scientists could grow after amending the soil were tomatoes, rice, watermelon, sunflowers, and corn.
Pick a crop you would want to plant in a reclaimed desert. Research that crop. Based on what you’ve learned about soil types and their components, what would you recommend adding to the soil to make it suitable to grow your crop? How much of each component would you add? Give your evidence and reasoning to support your idea.
Next-Generation Science Standards
This resource works toward the following performance expectations:
- MS-LS2-1 Ecosystems: Interactions, Energy, and Dynamics: Analyze and interpret data to provide evidence for the effects of resource availability on organisms and populations of organisms in an ecosystem.
- MS-ESS2-2 Earth’s Systems: Construct an explanation based on evidence for how geoscience processes have changed Earth’s surface at varying time and spatial scales.
- MS-ESS3-1 Earth and Human Activity: Construct a scientific explanation based on evidence for how the uneven distributions of Earth’s mineral, energy, and groundwater resources are the result of past and current geoscience processes.
Common Core State Standards
This resource works toward the following performance expectations:
- CCSS.MATH.CONTENT.6.RP.A.1 – Understand the concept of a ratio and use ratio language to describe a ratio relationship between two quantities.
- CCSS.MATH.CONTENT.7.RP.A.2 – Recognize and represent proportional relationships between quantities.
- CCSS.MATH.CONTENT.7.RP.A.3 – Use proportional relationships to solve multistep ratio and percent problems.
Credits
Lesson by Lisa Bright
Draft Development by Sandy Roberts and Xochitl Garcia
Copyediting by Crystal Erickson and Ariel Zych
Illustrations by Lydia Eykelestam Burton
Digital Production by Sandy Roberts
Educator's Toolbox
Meet the Writer
About Lisa Bright
Lisa Bright is a 6th-grade STEAM Math teacher at Richmond Hill Middle School in Georgia. She has passionately taught Math for 11 years in both middle and high school settings. With interests in a variety of topics ranging from video games to gardening, Lisa loves to show her students the Math that surrounds them every day.