Making A New Map Of The Moon
16:24 minutes
For centuries, we’ve been trying to get a better understanding of the surface of the moon. Different cultures have imagined faces, rabbits, and even toads hiding in the rocky features. Astronauts have walked on the lunar terrain—bringing back photographs and rock samples. And so far, there have been 21 moon landings. The most recent happened last January, when China successfully put a lander on the far side of the moon.
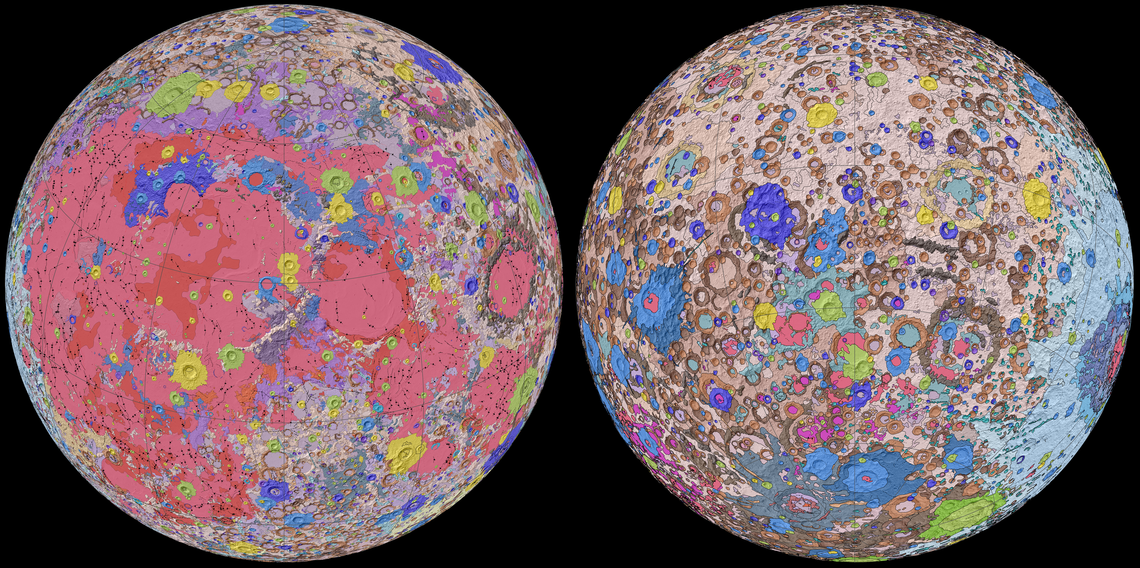
Recently, USGS scientists used their expertise in map-making to pull together some of these scientific observations to catalogue the geology of the moon. They stitched together six Apollo-era moon maps, combined with modern satellite data, to create a 360-degree map of the geological structures on the moon. This “Unified Geologic Map of the Moon” was published last month. USGS research geologist James Skinner, one of the creators of the map, takes us through the terrain of the lunar surface, and talks about what it can tell us about the evolution of the moon.
Plus, Michelle Nichols of the Adler Planetarium gives moon gazing tips to help you spot the different geological features of the moon.
 No telescope? No problem! On May 12, join Science Friday and the Adler Planetarium for Astro Artists Club as we point our digital ‘scope at the Sun to celebrate the Adler’s 90th anniversary. It’s a happy hour event for all ages! Sign up for the livestream!
Invest in quality science journalism by making a donation to Science Friday.
James Skinner is a research geologist in the Astrogeology Science Center of the U.S. Geological Survey in Flagstaff, Arizona.
Michelle Nichols is the Director of Public Observing at the Adler Planetarium in Chicago, Illinois.
JOHN DANKOSKY: This is Science Friday. I’m John Dankosky. For centuries, we’ve been trying to get a better understanding of the surface of the moon. Different cultures have imagined faces, rabbits, and even toads hiding in the rocky features. Astronauts have of course walked on the lunar terrain bringing back photographs and rock samples. And there have been 21 total moon landings. The most recent last January when China successfully put a lander on the far side of the moon.
There are countless scientific observations of the moon, but how are researchers using all of this data to fill in the picture of the lunar surface? Science Friday Producer Alexa Lim tells us more.
ALEXA LIM: When you think of space exploration, the US Geological Survey is probably not the first agency that comes to mind. USGS scientists use their expertise in map-making to catalog the geology of the moon. They stitched together six Apollo-era moon maps combined with modern satellite data to create a 360 degree view of the geological structures on the moon. Last month, the agency published what they called the unified geologic map of the moon.
James Skinner is one of the creators of that map. He’s a research geologist with the US Geological Survey’s Astrogeology Science Center. Welcome.
JAMES SKINNER: Thank you.
ALEXA LIM: I didn’t realize that the USGS had an Astrogeology wing. Why is the USGS particularly equipped to map places outside of the Earth?
JAMES SKINNER: I think we’re particularly equipped to do it just because we are a geological survey, and what geological surveys do is they explore and put things onto a map. So this is a compilation of six different maps that were created at 1-to-5 million scale. So that means one millimeter on the map is five millimeters on the ground, and that’s equal to one kilometer.
Often, if you have boundaries where different people are mapping different areas, when you cross those boundaries of the maps, you’ll have discrepancies. This is very common for geologic mapping. That happens on Earth and happens at different scales on multiple bodies. And so this new map that was put out is an attempt to reconcile all of those six different maps and coordinate them and refine them and put them into kind of one unified global geologic map of the moon.
ALEXA LIM: So is it fair to call you a celestial cartographer?
JAMES SKINNER: Celestial cartographer to me would kind of imply the stars, so I would prefer astrogeologist.
ALEXA LIM: Astrogeologist. OK. That works.
[LAUGHTER]
So the first thing that caught my eye were all the colors on the map. It looks like one of those giant jawbreaker candies.
JAMES SKINNER: Right.
ALEXA LIM: So what do all the colors represent?
JAMES SKINNER: I love the intersection of science and technology with art and rendering something that is technically complicated into a way that we can all use it and perceive. And that’s what geologic mapping to me is. It’s a piece of art at the intersection of art and science.
So the colors on this map, which are many, they kind of break down on time schemes. So the colors that are being represented are basically age groups. And the youngest ages that you see on this map are yellows. And those are derived from Copernican age craters, which are about a billion years old or younger. So [INAUDIBLE] younger and we’re talking about that being the youngest age. So this is kind of a difference on what we think of as being young when we’re talking about things that are off of this world.
So the next kind of– if you go back in time and you’re stepping back into time, these Eratosthenian craters, which are green. Or you go back in time, you have these Imbrian age craters, and those are usually depicted in blue. And then you’d have these browns and kind of these tan colors and those are the Nectarian and Pre-Nectarian units. Those are the ones that are 3.9 to 4.5 billion years old. So really primordial, really ancient and [INAUDIBLE].
And so that’s kind of the background of all the different crater terrains. And then superimposed on top of that you have these really pink and bright and warm colors, and those are the kind of younger age basalts or lavas that have erupted onto the surface and filled in the lower parts. These kinds of units, these warmer units, occur in the centers of impact craters.
ALEXA LIM: And I guess it makes sense but I didn’t realize there are geologic eras on the moon like there are on Earth. How many geological eras are there on the moon?
JAMES SKINNER: There are four. And then there is kind of an extra one to squeeze in there called the Pre-Nectarian. So if we go from right when the body was formed, so 4 and 1/2 billion years ago, that’s called the Pre-Nectarian, and then there’s the Nectarian, and then there’s the Imbrian, and then there’s the Eratosthenian, and then there’s the Copernican. And all of these are named for impact craters and basins on the moon. So the Copernican is obviously named for the Copernicus crater. The Eratosthenian is named for the Eratosthenes crater. And the Imbrian is named for Mare Imbrium, which is the sea of rain or the sea of showers.
Interestingly, all three of those impact craters are on the lunar near side. They’ve been studied in detail and they all overlap one another. And that’s really interesting because they set the boundaries for these divisions, these kind of chronological divisions on the moon. So we can see those. When you see bright things on the moon, they’re either the highlight materials, and typically the highlands are composed of a lot of impact craters.
Impact craters on the moon, if they’re younger, they have rays, so really bright rays that are coming from them. But over time, those rays darken because they’ve just been pummeled by cosmic radiation and solar radiation. So things that have rays are going to be young. That’s geologically speaking young. But they’re going to be typically Copernican in age. So Copernicus is the largest, brightest crater that still has some rays to it.
And I was looking at it this morning and there’s almost– there’s over 10,000 discrete bodies of rock that are identified on this map. So 10,000 little, little circles and polygons. So that’s what this map does a really good job of. It unifies everything but it also sort subdividing those different units and placing them in the correct time scheme.
ALEXA LIM: Like you said, you know? You found 10,000 different, I guess, units on the map. Can you kind of take us through some of the specific ones? Like navigate us through some of these interesting patterns or correlations that you saw on the map?
JAMES SKINNER: Yes. Sure. So I think one of the most interesting groups of units that are on this map are what’s called the Orientale group, and that is named for Mare Orientale, which is– if you’re looking at the map, I’ve got a flat map here that’s on the wall that I’m looking at, and it’s kind of these blue impact crater units that are in the central kind of western side of the map. So this is a really good expression of what this map is trying to do.
And so it shows a– those units, they’re called the Orientale group, and this is a pristine example of over-printing, that is cross-cutting relationships that result from a very large impact crater. So this crater is so large that it’s not even a crater anymore. It’s actually a basin. When they get to be this big, there’s multiple rings. So it doesn’t have just one ring. It’s so big that it has multiple rings around it that form around.
So this is a really good example of when you have a large impact crater it basically resets everything around it. There’s so much rock and material that’s being ejected from this one place on the moon way back when this impact crater formed that it is spreading out all this ejected material all over this region of the moon. And it’s basically resetting everything. You kind of look at it like a etch-and-sketch. so this region the moon was etch a sketch away and then it kind of reset the timing. So all the things that are sitting on top of that are the younger pieces. So that’s a really interesting– kind of one of the key places that we look at and understand the temporal sequencing and how it fits together in both time and space.
ALEXA LIM: Your next map, you’re going to zoom in and make a more detailed map of the south pole of the Moon. Why are you focusing there?
JAMES SKINNER: The south pole is interesting because it has regions that are permanently shadowed. And then those permanently shadowed regions we understand there to be ice deposits. So I suppose it’s going to be critical for exploration. And so it’s important for us to start understanding what the distribution of geologic terrains are in those areas.
So those four of us mapping it, we each have a little pie piece that we’re mapping. And what we’re trying to do is take this map that was produced and try to adapt those units that are identified there at 500,000 scale. So this is a perfect example of utility of this kind of product is extrapolating out into local scales.
We want understand. So we’re seeing these kind of different kinds of terrains and we want to be able to see how they all fit together. So we might be able to get a little more information about where we might send the next generation of explorers. When we send robots and our next explorers there, whether they’re robots or humans, we will use this map to start to winnow down the regions that we’ll go to.
We’re not going to be able to select sites specifically from this map, just because the scale is so different. It’s a global map. But what it does allow us to do is to start focusing in on those regions. And it also lets us start to understand what and where particular resources might be, and resources being different things. They can be solar illumination that we need to have for powering things. And if something is stable enough, if a rock terrain is stable enough to be able to take some kind of solar cells. It allows us to identify where aggregates might be that we need to push together in a lunar bulldozer to be able to protect a habitation unit.
So it allows us to start seeing those kinds of things and what materials and what resources might be there, where they would be, the distribution of them, and how much there might be.
ALEXA LIM: OK. So you have this map of the Moon. You’ve also worked on a map of Mars. If you could choose anywhere else inside the solar system, outside the solar system, wherever, where would you personally want to map next?
JAMES SKINNER: So you’re saying besides the Moon or Mars?
ALEXA LIM: Yeah.
[LAUGHTER]
JAMES SKINNER: That’s hard. So I think that, you know, Venus is really interesting because I like these terrestrial bodies. So those are the bodies that kind of sit inside the asteroid belt in the inner solar system. Because they seem like they fit on a continuum of kind of Earth-like planets. So even the Moon that looks kind of alien when we look at it from a geologic mapping perspective, it’s kind of like a frozen little mini Earth. Venus is kind of on the other side of Earth, where it has a runaway greenhouse effect, it’s a little bit larger than the Earth, it has massive volcanism, the crosses apparently smashing into each other and forming really large mountain chains and big fractures. And so Venus is a nice place to do this kind of work as well because there’s some really interesting features to identify.
ALEXA LIM: All right. Well, we’ll have to keep an eye out for it.
JAMES SKINNER: Please do.
ALEXA LIM: All right. Well, thanks so much for joining us.
JAMES SKINNER: Thank you so much. It was a pleasure.
ALEXA LIM: James Skinner is a research geologist with the US Geological Survey’s Astrogeology Science Center. And we have that map up on our website at sciencefriday.com. Now, if you want to be able to spot those mountains and highlands for yourself, my next guest is here to give us some Moon-viewing tips. Michelle Nichols is director of public observing at the Adler Planetarium in Chicago. Welcome.
MICHELLE NICHOLS: Thank you.
ALEXA LIM: So for someone just starting out, the beginer Moon-gazer, what features should you look for to help navigate and orient yourself on the Moon?
MICHELLE NICHOLS: Well, the first thing to do is to figure out when the Moon is actually going to be visible. So if people are not familiar with Moon phases or when you should go out, the best advice I can give is to look up the date of new Moon. And so that means the Moon is in the same direction of the sky as the Sun, so you’re not going to see it.
Then, maybe a couple of days later, if it happens to be clear, go out right around sunset, look to the west, and you’ll see a very tiny sliver. And so after that date, then the Moon is going to continue to move in its orbit around the Earth and you’ll see more and more of the moon lit up by the Sun. And so then, that way you can then get a sense of what you’re going to be seeing from one night to the next. And then, when you get to full Moon, which is about two weeks after new Moon, that’s when you can see the full entire Moon, the entire side that faces us. You can see those light areas and those dark areas. That’s a great time to really start to get to know the Moon.
ALEXA LIM: Right. And should you grab a moon map? Is that helpful to help you look at things?
MICHELLE NICHOLS: Yes. Some times it’s helpful. So it’s just a simple Moon map. If you don’t have a telescope or a pair of binoculars, then just getting to know those light areas, those dark areas, those dark areas are hardened lava regions and the lighter areas are mountains, so that’s a great time to get to know those regions. And then, when you do have a small telescope or a pair of binoculars, then you can start to see some craters and some other features.
ALEXA LIM: There’s a way to kind of see sunrise on the Moon?
MICHELLE NICHOLS: Yes. So when you’re looking at the moon and you see there’s a dividing line between light and dark, and we call that the terminator. And if you were standing on that line between light and dark, you would be seeing either sunrise or sunset on the moon depending on where the moon is in its orbit around the Earth. And so where you would be there, the shadows would be really long, just like they are here on Earth when it’s close to sunset and the closer we get to sunset, the shadows get longer and longer. So that would be what you’ll be seeing if you were standing on the moon.
And then, if you’re looking at it through a telescope or binoculars, you can see these long shadows, you can see little bits right on that terminaro that have been lit up by the Sun, but other bits haven’t experienced sunrise yet. And when you look the next day, you can see other little bits that have been lit up by the sun. So it’s really neat to explore because the Moon looks rather 3D at that point. And so it really becomes a place to look at that time.
ALEXA LIM: I’m Alexa Lim and this is Science Friday from WNYC Studios. And sometimes when you walk outside it looks like the Moon has overtaken the entire sky. This is due to something called the moon illusion. What is that?
MICHELLE NICHOLS: People probably notice this quite a bit. If you see the full moon and it’s really, really close to the horizon, it may look enormous. And then, when you look at it a few hours later and it’s higher up above the horizon, not quite so big. But it is an illusion. It’s your brain trying to reconcile stuff that’s close by you, some trees, houses, buildings, and then, the Moon, which your brain knows is far away.
So what you can do to kind of test this out right when you see the moon as close to the horizon as you possibly can– and we’re talking full Moon. This is when it shows up best– look at it, stick your thumb out at arm’s length and hold your arms straight out, stick your thumb out, close one eye, compare the size of the full moon to the size of your thumb. And then do that again a few hours later. And I’m going to have to give the punchline to it, but it’ll be the same size. And it’s really kind of freaky when you see that for the first time and you really compare it to something standard, like the size of your thumb. So try it out. It’s kind of fun and kind of weird.
ALEXA LIM: Next week, you’re joining Science Friday for a livestream to talk about our other favorite celestial neighbor, the Sun. What will you be doing during that event?
MICHELLE NICHOLS: Well, we are going to be talking about viewing the sun safely through a telescope, some features that are visible on the Sun. We’re going to be inviting folks to make artwork that is inspired by the Sun and share those images with us as they’re making them. It’s going to be a lot of fun. We’re going to connect to objects in the Adler planetarium’s historic collection. So there’s going to be a lot of accessibility points for many people to enjoy our other really important celestial neighbor, the Sun.
ALEXA LIM: Great. Well, thanks so much for joining us.
MICHELLE NICHOLS: Thank you so much for having me.
ALEXA LIM: Michelle Nichols is the director of public observing at the Adler planetarium in Chicago. And you can join Michelle at our online event next week. It’s an all-ages astro-artist club, next Tuesday, May 12th, at 7:30 PM Eastern. You can sketch and learn more about the Sun. You can find more information on our website at sciencefriday.com/astroclub. This is Science Friday. I’m Alexa Lim.
Copyright © 2020 Science Friday Initiative. All rights reserved. Science Friday transcripts are produced on a tight deadline by 3Play Media. Fidelity to the original aired/published audio or video file might vary, and text might be updated or amended in the future. For the authoritative record of Science Friday’s programming, please visit the original aired/published recording. For terms of use and more information, visit our policies pages at http://www.sciencefriday.com/about/policies/
Alexa Lim was a senior producer for Science Friday. Her favorite stories involve space, sound, and strange animal discoveries.