The Messy Math Of Mammograms
Math biologist Kit Yates breaks down the numbers behind breast cancer screenings—and the serious implications of false positive and negative results.
The following is an excerpt from The Math of Life and Death, by Kit Yates.

In the spring of 2014, Dominique Berry went to see her doctor to have an irritating skin condition examined. During the consultation at the clinic in downtown Chicago, Dominique’s physician noticed a small lump under the skin on her chest. After discovering that Dominique had been ignoring the lump for several weeks, her doctor insisted she have it examined further.
Four days later Dominique arrived at the imaging center for her first-ever mammogram. After a painfully unpleasant few minutes of standing with her breast in a clamp, Dominique retreated to the waiting room, where the nurse eventually found her and told her that the doctor was unhappy with the results. He had discovered a larger mass deeper inside the breast than the lump that had first brought Dominique to the hospital. He requested that she return to undergo a needle biopsy on April 1—April Fools’ Day.
In the intervening two weeks, while Dominique presented an outwardly calm persona at work, on the inside she was falling apart. She agonized about telling her family, but decided she couldn’t risk anyone knowing, not even her mother, in case the news leaked out. Instead she relied solely on only her husband for support and threw herself into her work to distract herself from the potential implications of her positive mammogram.
Most patients who undergo mammograms perceive them to be a fairly accurate way of screening for breast cancer. Indeed, for people who have breast cancer, the test will pick this up roughly nine times out of ten. For people who don’t have the disease, the results of the test will tell you this correctly nine out of ten times. Knowing these statistics and having received a positive mammography result, even before the biopsy Dominique considered it likely that she had cancer. However, a simple mathematical argument demonstrates that the opposite is true.
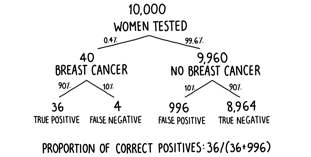
The prevalence of undiagnosed breast cancer in women over forty-five—those for whom routine screening is recommended—is slightly higher than in the general female population and can be estimated at around 0.4 percent. The fates of 10,000 such women are broken down in figure 5. We can see that, on average, only 40 of them will have breast cancer, so 9,960 will not. However, one in ten, or 996, of the women who are free of the disease will be given an incorrect positive diagnosis. Compared to the 36 women who are correctly diagnosed as having the disease, this means that a positive test result is correct only in 36 of 1,032 cases or 3.48 percent of the time. The proportion of positive test results that are true positives is known as the precision of the test. Of the 1,032 women to receive a positive result, only 36 of them will actually have breast cancer. To put it another way, if your mammogram comes back positive, the overwhelming likelihood is still that you don’t have breast cancer. Despite appearing to be quite an accurate test, the low prevalence of the undiagnosed disease in the population makes it extremely imprecise.
Poor Dominique didn’t know this, and neither do many of the women who undergo such tests. Indeed, many doctors are unable to interpret positive mammograms. In 2007, 160 gynecologists were given the following information about the accuracy of mammograms and the prevalence of breast cancer in the population:
The physicians were then faced with a multiple-choice question asking them to identify which of the following statements best characterized the chances that a patient with a positive mammogram actually has breast cancer:
A) The probability that she has breast cancer is about 81 percent.
B) Out of ten women with a positive mammogram, about nine have breast cancer.
C) Out of ten women with a positive mammogram, about one has breast cancer.
D) The probability that she has breast cancer is about 1 percent.
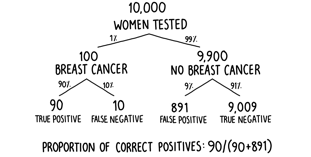
The most popular answer among the gynecologists was A—that a positive result in the mammogram will be correct 81 percent of the time (around eight times out of ten). Are they right? Well, we can work out the correct answer by considering the updated decision tree shown in figure 6. With a 1 percent background prevalence, of 10,000 randomly selected women, on average 100 will have breast cancer. Ninety of these will be told correctly that they have the disease by the mammogram. Of the 9,900 women who don’t have breast cancer, 891 will be incorrectly told that they do have breast cancer. Of a total of 981 women with a positive result, only 90 of them—or roughly 9 percent—will actually have the disease. Worryingly, the gynecologists massively overestimated the true value. The correct answer was chosen by around one-fifth of respondents, a worse result than if all the doctors had just selected from the four answers at random.
As it turned out, when April 1, the day of the biopsy, finally came around, the results showed that the mass in Dominique’s breast was an unconcerning benign growth—the whole troublesome affair, in retrospect, turning into the most welcome April Fool she’d ever received. Her travails, though, are typical of the majority of women who receive a positive mammography result. With repeated mammograms, as directed by most screening programs, the chances of receiving a false positive go up. Assuming false positives occur with equal probability of 10 percent (or 0.1) in each test, the correct diagnosis of a true negative occurs with a probability of 90 percent (or 0.9). After seven independent tests the probability of never having received a false positive (0.9 multiplied by itself seven times, or 0.97) drops to less than a half (approximately 0.47). In other words, it only takes seven mammograms before an individual free from breast cancer is more likely to have received a false positive than not. With mammograms suggested every year between the ages of forty-five and fifty-four and then every two years after that, women who follow this advice might expect at least one false positive in their lifetime.
Excerpted from The Math of Life and Death by Kit Yates. Copyright © 2019 by Kit Yates. Reprinted by permission of Scribner, an imprint of Simon & Schuster, Inc.
Invest in quality science journalism by making a donation to Science Friday.
Kit Yates is author of The Math of Life and Death: 7 Mathematical Principles That Shape Our Lives (Scribner, 2020), a senior lecturer in Mathematical Science, and co-director of the Center for Mathematical Biology at the University of Bath in Bath, England.