Grade Level
9-12
minutes
1- 2 hrs
subject
Environmental Science
Activity Type:
civic engagement, data analysis, environmental justice
![]()
This resource was created as part of the Science Friday Educator Collaborative. If you are implementing this in the classroom, please check out the Educator’s Guide for tips for classroom use.

Around the world, some of us are not able to drink from the tap because the water is loaded with toxic heavy metals that have seeped into the groundwater. Some of us have to stay indoors for days on end because the air outside is too hazardous to breathe. For millions of people, and maybe even you, this is what everyday life is like—home is in communities where the water, air, and/or soil has been contaminated by dangerous industrial byproducts and waste.
There is a mountain of research proving that some types of industrial pollution negatively affect human health. Communities for a Better Environment, a nonprofit organization that empowers citizens to take action against industrial polluters in their communities, explains that “the principles of environmental justice say that access to clean air, water and soil and to a healthy, safe, livable community are intrinsic human rights.”
So why is industrial pollution worse in some communities and not in others?
In this activity, you will use open data sets about environmental exposure and demographics to look for geographic connections between polluting industries, different types of communities, and human health impacts. Then you will explore how communities use the power of data to advocate for accountability and change. Finally, you will take your own action for environmental justice by uniting the power of data with the amplifiers of storytelling and social media.
Activity 1: Who Bears The Pollution Burden?
Data is an incredibly powerful tool for scientists, researchers, activists, and citizens who do environmental justice work. It helps uncover connections between areas of concentrated pollution and the people who live in those areas. With data, a small group of organized citizens can hold a multinational corporation accountable and get it to clean up its act.
We too can use data to become more informed and activated civic participants, and to become allies in the fight for environmental equality for everyone.
The CalEnviroScreen dataset from the Office of Environmental Health Hazard Assessment (OEHHA) captures the data for over 20 pollution and vulnerability indicators. The OEHHA publishes pollution, human health indicators (such as asthma), and demographic data for every census tract in the state of California. Their mission is to “protect and enhance the health of Californians and our state’s environment through scientific evaluations that inform, support and guide regulatory and other actions.”
The CalEnviroScreen map has census tracts outlined and color-coded by relative pollution burden. Each census tract contains the same number of people—smaller census tracts have a higher density of people in them.
Explore The Data And Collect Observations
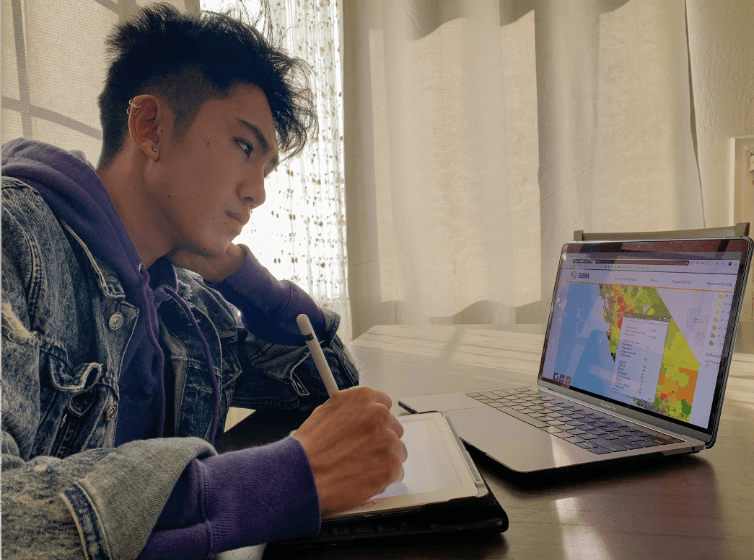
We’re going to use CalEnviroScreen to begin identifying connections between populations and pollution in California. Use the Google Slide below to move through the activity and record your responses on your California Environmental Justice Exploration Worksheet.
What factors correlate to a heavier pollution burden?
Make Connections
Now that you’ve examined the pollution burden data for a few census tracts, make some connections back to our original question. Which communities bear the pollution burden? Record your responses on your California Environmental Justice Exploration Worksheet.
- Besides pollution burden, what are the major differences between the red and green tracts? Be sure to address each specific area (linguistic barrier, poverty, racial profile, etc.).
- What relationships can you identify between race and pollution percentile?
- What about poverty percentile and percentile pollution?
- Are there other kinds of information that also appear to be related to pollution distribution?
- What relationships exist between pollution exposure and human health?
If you find yourself asking more questions, go back to the data and see what answers you can find.
Data Is Power
Traditionally, access to research and data collected by academic scholars, government officials, and scientists has been restricted, kept out of reach from the public. As a result, while we, the public, may have suspected that our communities were being exposed to dangerous pollution, it was almost impossible to investigate our concerns.
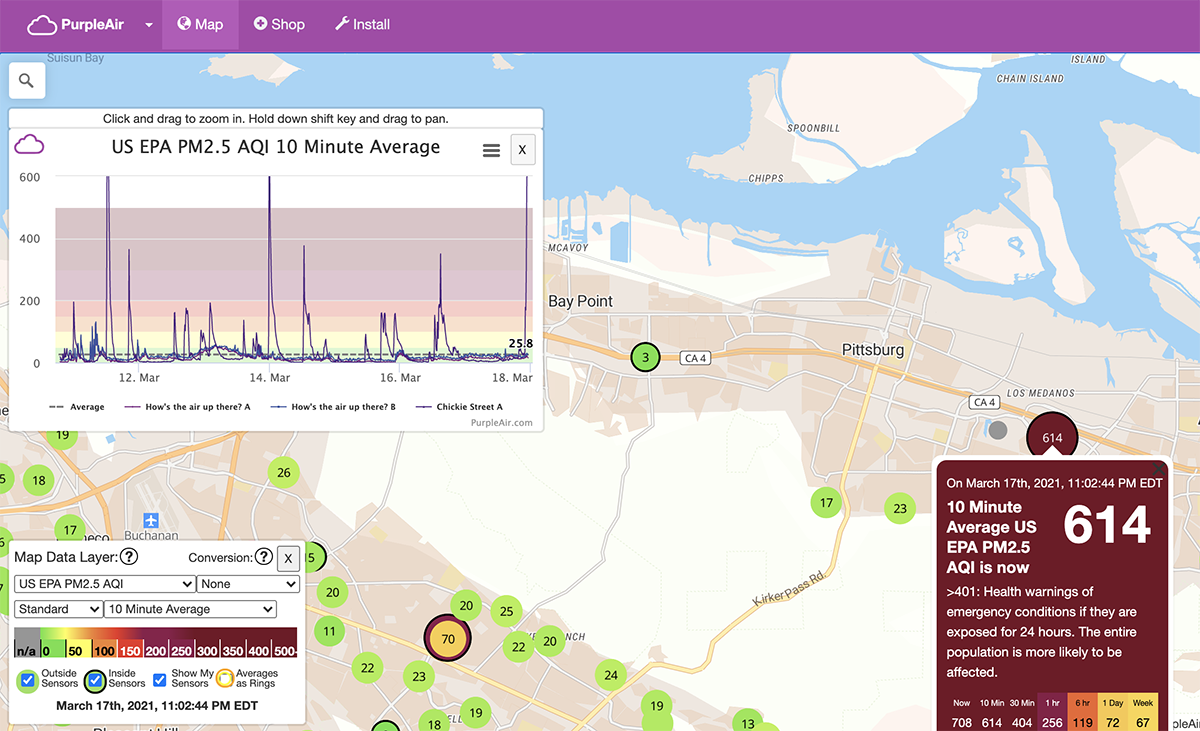
We are now able to interact with publicly available or “open” data sets, as you did in the previous activity. Open data sets about environmental exposure and health are available thanks to governmental organizations, public health departments, non-governmental agencies (NGOs) like the Sierra Club and citizen science databases like PurpleAir. With open data, we can answer critical questions:
- Is my community exposed to pollution?
- What kind of pollution is affecting my community?
- What environmental resources are at risk?
- What relationship exists between pollution exposure and human health?
- What other communities are vulnerable to pollution?
- Are all communities impacted equally by pollution?
With access to environmental exposure and health data, we gain an understanding and evidence of the risks to our communities. Empowered with this information, we also gain tools to take action.
SciFri Extra: Bringing Environmental Justice To The Classroom
The Path Of Least Resistance
Now that you’ve examined data from California and looked closely at race and poverty indicators, ask yourself: Who bears the greatest burden of pollution, exposure in the state?
Those findings from your data dive about California are, in fact, almost universally true in the United States. Significant research shows that pollution, especially industrial pollution, disproportionately affects marginalized communities—communities that are predominately Black, Indigenous, people of color, low-income individuals and families, and/or first generation families.
If we all benefit from the products that polluting industries make, why is it that we do not all bear the pollution burden equally?
This problem is rooted in America’s historic and enduring systemic racism, where white people receive benefits from racism and people of color bear the costs. Exclusion, discrimination, and oppression based on race in real estate, banking, education, employment, healthcare, and other systems in our society have kept generations of families from accruing property and wealth.
“Not in my backyard”—or NIMBY—movements have primarily benefited wealthier, White citizens who exert pressure to prevent polluting facilities or “unwanted” zoning in Whiter, more affluent communities. Instead of advocating for cleaner industry, NIMBY movements in essence move polluting to marginalized communities who have less power within the system.
In addition, marginalized citizens are more likely to:
- Have a linguistic barrier
- Be unable to vote
- Work hours that make it impossible to attend town hall meetings
- Live in or near poverty, due to economic inequality
Another pattern in the history of industrial real estate development: the path of least resistance. When a company needs to build a new factory or even a hazardous waste site that brings with it increased pollution, they often choose to build in marginalized communities. There, the company will meet minimal (and easily surmountable) challenges to building their factory, and will likely be able to contaminate local environmental resources without having to take any responsibility. In two 2016 studies, researchers found that there was a long-term pattern of companies targeting minority and low-income communities when deciding where to put polluting facilities.
The result of these conditions? It’s incredibly difficult for marginalized communities to push back against industrial development and its dangerous outputs. The unequal environmental exposure Black, Indigenous, and other non-White communities experience is a direct result of persistent systemic racism.
In your first activity, you examined data to see how these staggering inequities play out by zip code. The central focus of environmental justice activism is dismantling the systems that trap marginalized communities in toxic neighborhoods. So now let’s look at how one city in California began to fight back against the polluters in its backyard.
Pittsburg: A Case Study In Environmental Justice
Let’s zoom in on a city in California to investigate how the connections we observed in the CalEnviroScreen data, as well as the documented relationships between industrial pollution and marginalized communities, are affecting the local environment and impacting residents.
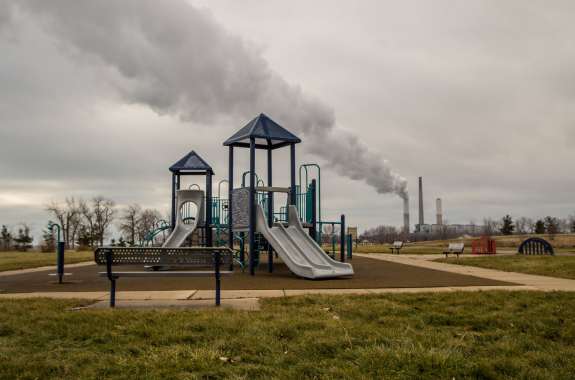
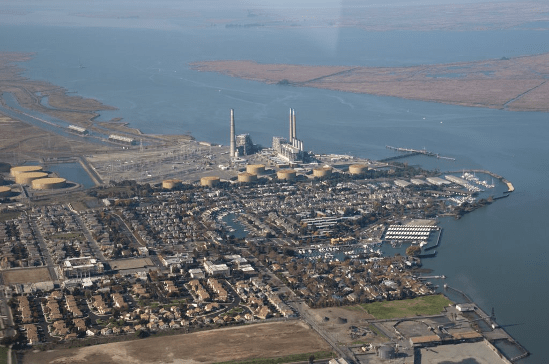
Pittsburg is a city in the East San Francisco Bay Area. It is predominantly a community of color—77% of residents are Brown or Black. If you look up from Pittsburg’s picturesque marina walkways, you will see its beauty is overshadowed by smokestacks and warehouses. The city is also home to a Dow Chemical plant and a power plant, in addition to other industrial production facilities.
In the next activity, you will explore and organize data about Pittsburg to discover the scope of its pollution problem, and the consequences that it creates for residents. After, we will learn how the Pittsburg community used the data you’re about to see to empower themselves, shifting the power dynamic to hold local polluters accountable.
Activity 2: How Polluted Is Pittsburg, California?
Let’s begin by diving into the data that is publicly available for Pittsburg, zip code 94565, on CalEnviroScreen.
Make Connections
Now that we have explored the data for this part of Pittsburg, learned about pollution and toxic events, as well as their effects on human health, let’s start making connections.
- How do you think toxic releases impact the people living nearby?
- Do you think there are other examples of polluting by industry in Pittsburg? How might you find out?
- How do you think we can use data to take action?
- How might you begin to work with this community to aid in their efforts to combat environmental injustice?
Educators, click here for a Claim Evidence Reasoning (CER) Worksheet to engage students in building arguments from evidence.
We have investigated the open data about Pittsburg, and we can see that the city is an intensely polluted and impacted community—and we know that’s because of income inequality, systemic racism, and other factors that create huge environmental injustices. Let’s look at the history of Pittsburg to gain context.
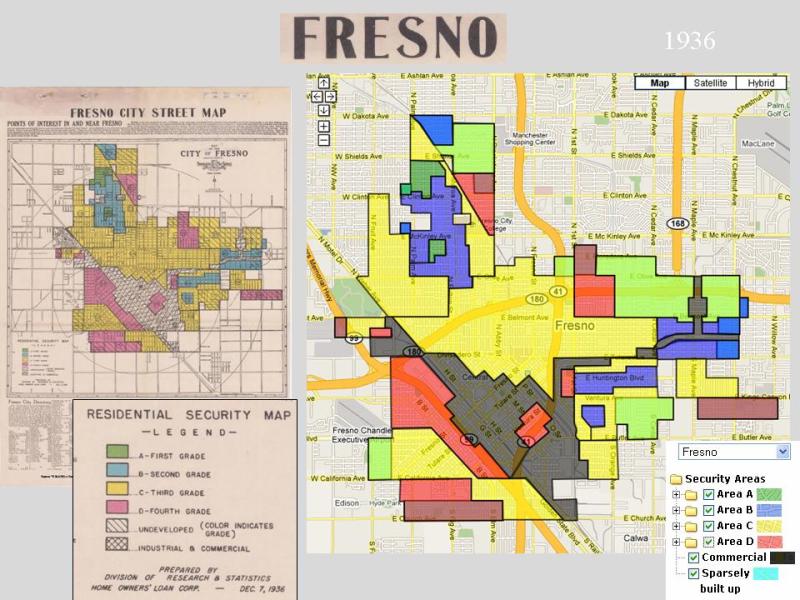
Activity 3: Investigate Pittsburg's History
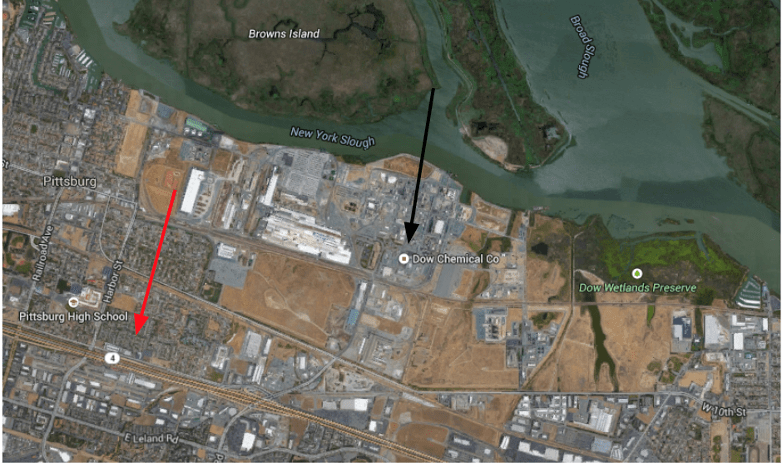
California’s Environmental Protection Agency (CalEPA) lists the pollution burden for the neighborhood closest to the Dow Chemical Plant at 90-95%. This means that the pollution burden in this census tract is worse than 90-95% of the census tracts in all of California.
Think about your Pittsburg investigation and reflect on the following questions:
- Why do you think neighborhoods of color are bearing the burden of our collective pollution?
- How did Pittsburg become such a polluted community?
- What role does poverty and race play in the environmental quality of neighborhoods?
- Reflect on what this community did about their pollution exposure. What tools and support do you think were most critical?
- What role do public health officials and scientists have to play in addressing this inequity?
- What role do community organizers play in these communities?
Cities and towns don’t become polluted by chance. They are intentionally, carefully exploited over time.
Pittsburg has a long history of environmental abuse and exploitation. Explore and scroll through the story map below, which details the history of Pittsburg and that community’s fight for a cleaner and healthier environment.
Dow is poisoning the land and air and endangering the health of the community. In Pittsburg, citizens brought their observations and concerns to the nonprofit Communities for a Better Environment (CBE), which “provides residents in blighted and heavily polluted urban communities in California with organizing skills, leadership training and legal, scientific and technical assistance, so that they can successfully confront threats to their health and well-being.” With help from the Environmental Integrity Project, CBE sued Dow Chemical for failing to meet RCRA hazardous waste regulations. In their lawsuit, they cited the following injustices:
“Dow is treating and storing hazardous waste without a permit in the Chlorinolysis Plant and all subsequent, associated stages of treatment within the Wastewater Treatment System…. According to samples taken from 20 tanks that provide the feed stream to the Chlorinolysis Plant (part of the Wastewater Treatment System), the pH renders the wastewater characteristically hazardous due to corrosivity. Further sampling by NEIC indicated that some of these wastewaters also contain levels of carbon tetrachloride and tetrachloroethylene above the hazardous waste toxicity characteristic limit…”
From data to local nonprofit to lawsuit, having access to data and allies gave residents in Pittsburg a way to fight the big polluter in their backyard.
The movement to treat access to clean air, water, soil, and to a safe and livable community as a basic human right is called the environmental justice movement. There is a strong tradition of marginalized communities taking action to protect themselves from pollution. In fact, in states like California, grassroots movements to demand clean air, water, and soil have been happening for decades. In the 1960’s, Cesar Chavez, one of the first environmental justice activists, advocated for farmworker rights that would protect them from pesticide exposure.
The more data communities can access and understand, and the more data literate you are, the better able we will all be to hold polluters accountable, so we all can start bearing the burden of industrial pollution equally.
Activity 4: Investigate An Environmental Injustice And Take Action
It’s not just Pittsburg, or even just California. We all deserve to have equal access to clean air, water and soil. Learning about environmental injustices helps us all become better informed, so that communities that have been historically disadvantaged don’t need to disproportionately bear the burden of our society’s pollution. There are clear connections between pollution exposure and negative human health impacts.
Use the Google Slides to dive into four other examples of environmental injustice.
Speak Out Against An Injustice That You Care About
Now, it’s your turn to investigate an environmental injustice using data. There are many resources like CalEnviroScreen that can be used to track the effects of pollution. Environmental Justice Atlas, for example, is a collaborative effort from “academics, concerned citizens, informal committees, NGOs and other activist groups” to map global environmental injustice. This powerful platform allows anyone, anywhere, to learn about pollution at home and around the world.
Using one of the mapping resources linked in the Pollution Data Resource, choose a location to investigate. You’re not restricted to California. You should choose a location that matters to you.
- Look at the maps and then move to a data dive.
- Explore environmental reporting from the region by conducting an online search for incidents in the region.
- Now, make connections by thinking about these questions.
- What is causing the pollution?
- What are the human health impacts?
- What actions can you take to address this issue?
Tell The Story Of Environmental Injustice
Data alone is not enough to get people to take action. You need to bring together your findings and explain your conclusions. Journalists, activists, and advocates then take those conclusions and weave them into stories that educate and inspire action. There are many ways to tell stories of environmental injustice–with images, art, maps, and words.
One of the newest and most impactful ways is to create a story map, which you used during the Pittsburg investigation. Newspapers like The Washington Post and The Times of London use story maps to help visualize a story across a geographic space, like in this story of environmental injustice in Chester, Pennsylvania.
If you want to try your hand at making a story map using the findings from your investigation into an environmental justice issue, here is a guide to help get you started.
Take Action By Spreading The Word
Education and awareness are the drivers of social change. The more we engage in social justice issues, the sooner our civil servants will advocate for us. Informing others about how industrial polluters are taking advantage of communities is an important first step in taking action. You can take a traditional approach like writing letters, making calls, or attending a town hall meeting, or try participating in social justice through art, or organizing a toxic tour.
One of the easiest ways to spread the word is through social media. We can use social media to propagate a more activated social awareness amongst our online communities. Check out these examples from some community organizations, NGOs, politicians and activists that are bringing awareness through their social media. As you are looking at these Twitter posts, think about the following:
- Who is tweeting?
- What message are they conveying?
- What is the power in this message?
Now it’s your turn to get the word out. Start your own environmental justice social media campaign and hashtag around the issue you’ve been investigating. Share your story map, or create a post or Tweet from your findings. Follow the local nonprofits doing work in the location you investigated, and share their posts with credit. When you share, be sure to @mention the political leader you want to see your post, and use at least three popular hashtags that are already being used for that issue.
What is the aim of our activism? A faster move to cleaner industries, empowered communities, and, ultimately, environmental justice for all. Not all of us experience pollution equally. But because we all use resources that create pollution, it is incumbent upon us all to share the burden pollution creates. Regardless of our own pollution exposure, there are ways we can advocate for a clean, healthy environment for everyone. Your ability to investigate injustice and activate your findings to create change is powerful. And we need you to use your power to end environmental inequality. But because we all use resources that create pollution, it is incumbent upon us all to share the burden pollution creates.
Next Generation Science Standards
This resource can be used to work towards the following NGSS Performance Expectations.
HS-ESS3-3: Create a computational simulation to illustrate the relationships among management of natural resources, the sustainability of human populations, and biodiversity.
HS-ESS3-1: Construct an explanation based on evidence for how the availability of natural resources, occurrence of natural hazards, and changes in climate have influenced human activity.
Science and Engineering Practices: Analyzing and Interpreting Data, Engaging in Arguments from Evidence
Crosscutting Concepts: Patterns, Cause and Effect
Credits:
Written by Laura Diaz
Edits by Abigail Holstein and Xochitl Garcia
Review by fellow 2019 Educator Collaborators Jessica Metz, Chenille Williams, Jennifer Powers, and Hillary Gutierrez
Digital Production by Xochitl Garcia
 A selection of Science Friday’s podcasts, teaching guides, and other resources are available in the LabXchange library, a free global science classroom open to every curious mind.
Meet the Writer
About Laura Diaz
Laura Diaz is the founder of the Educator Collective for Environmental Justice. Her work is centered in the cross-section between educators, students, and the community using environmental justice action projects. A former professional salsa dancer, Laura particularly enjoys dance parties with her son.