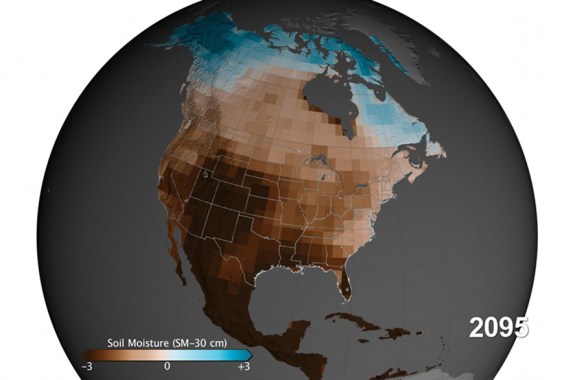
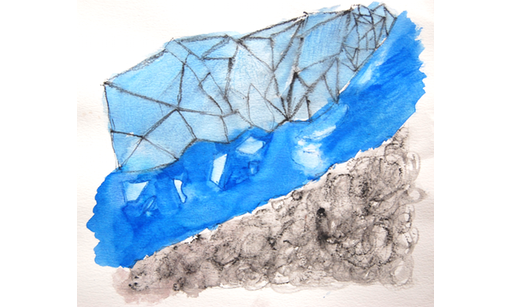
Illustrated Graphs: Using Art to Enliven Scientific Data
Create an illustrated graph using real scientific data, and write an artist’s statement to explain your thinking. Try it with climate change!
10:16
Extreme heat affects an airplane’s lift during takeoff and landing, due to reduced air pressure, and some experts say climate change could result in more weight restrictions on flights.
12:15
Rethinking the rules of running reservoirs, and will climate change help wine makers?
11:52
Sea lions struggle to navigate after domoic acid exposure, and communities around the world try to innovate in the face of climate change.
11:50
Climate change might be pushing the Southwest and Central Plains of the U.S. towards megadroughts.
How will the midterm election results, climate change “debate,” and trends in renewable energy affect the 2016 election?
This hybrid coral could withstand climate change better than its relatives.
Exploring vulcanism ’round the world, an avian-centric climate change report, Earth-like tectonic activity on a Jovian moon, and more.
22:35
A look at the effects of conservation efforts and climate change on bird populations in North America.
12:12
Move over polar bears—could penguins be the new poster children for climate change?