Can You Read A Bar Graph?
12:00 minutes
Bar graphs seem like one of the simplest ways to represent data. Many people assume that the longer the bar, the bigger the number it represents. Sometimes bar graphs represent an average not a total count, which is trickier to understand.
And because bar graphs are everywhere, psychologists from Wellesley College wanted to determine how well people can actually read and interpret bar graphs. Turns out, one in five people in their study misunderstood the data the bar graphs intended to show. And sometimes simple-looking graphs actually make it harder to understand the data they are based on.
Ira talks with Jeremy Wilmer, associate professor, and Sarah Horan Kerns, research associate, at Wellesley College’s department of psychology, based in Wellesley Massachusetts about their bar graph research and curriculum to improve data literacy.
If you’re curious whether you’ve been missing the bar with your chart interpretation skills, try out this little challenge below that mirrors the study by Kerns and Wilmer. You’ll need something to write with, and either a piece of paper or a printout of the chart below.
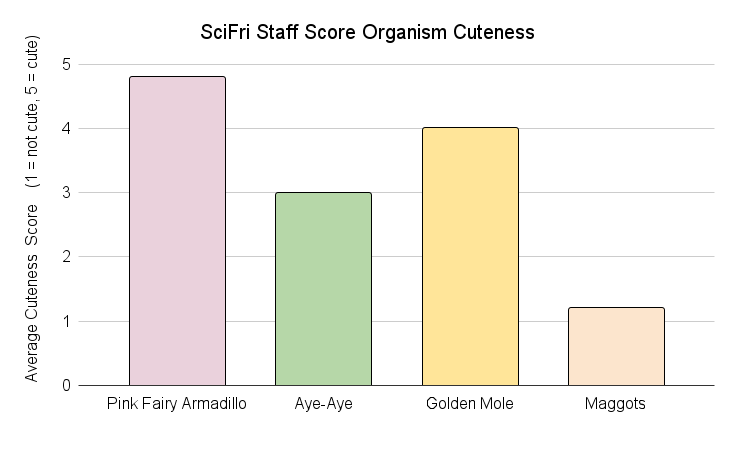
What does your bar graph sketch look like? More like A, or more like B below?
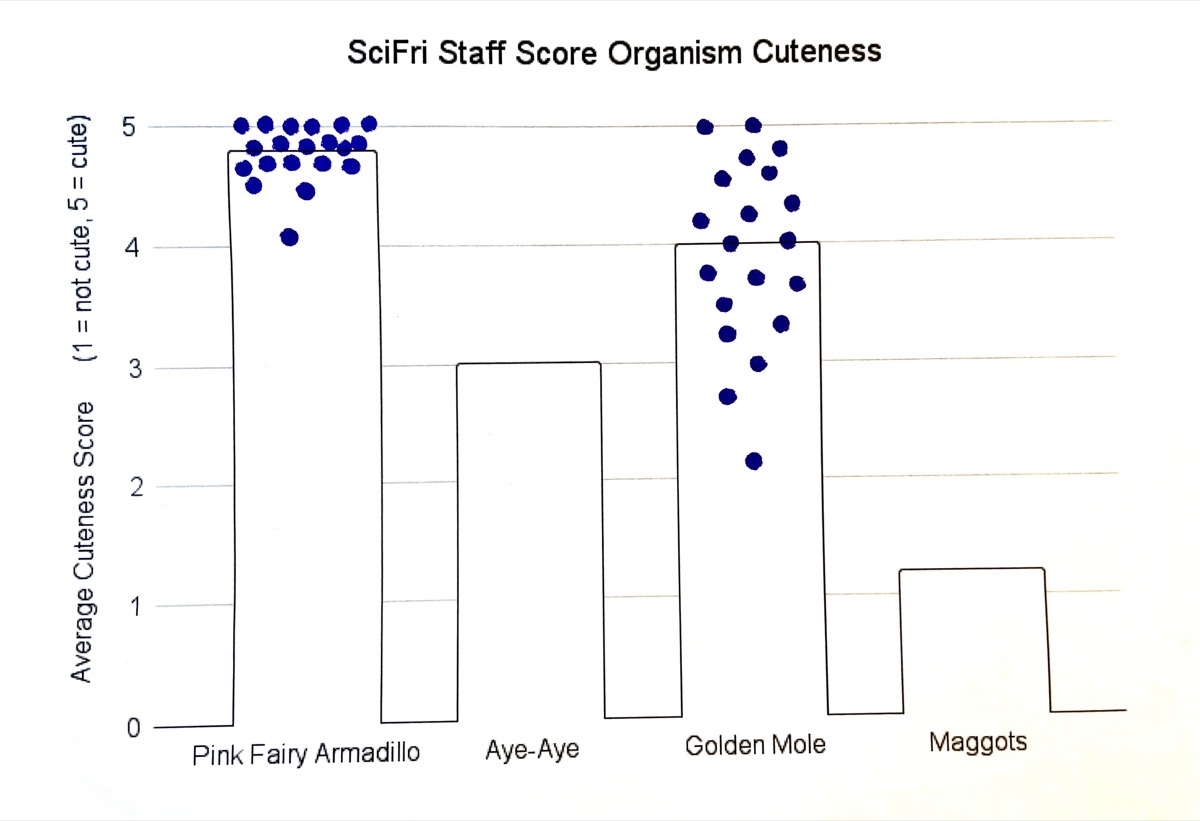
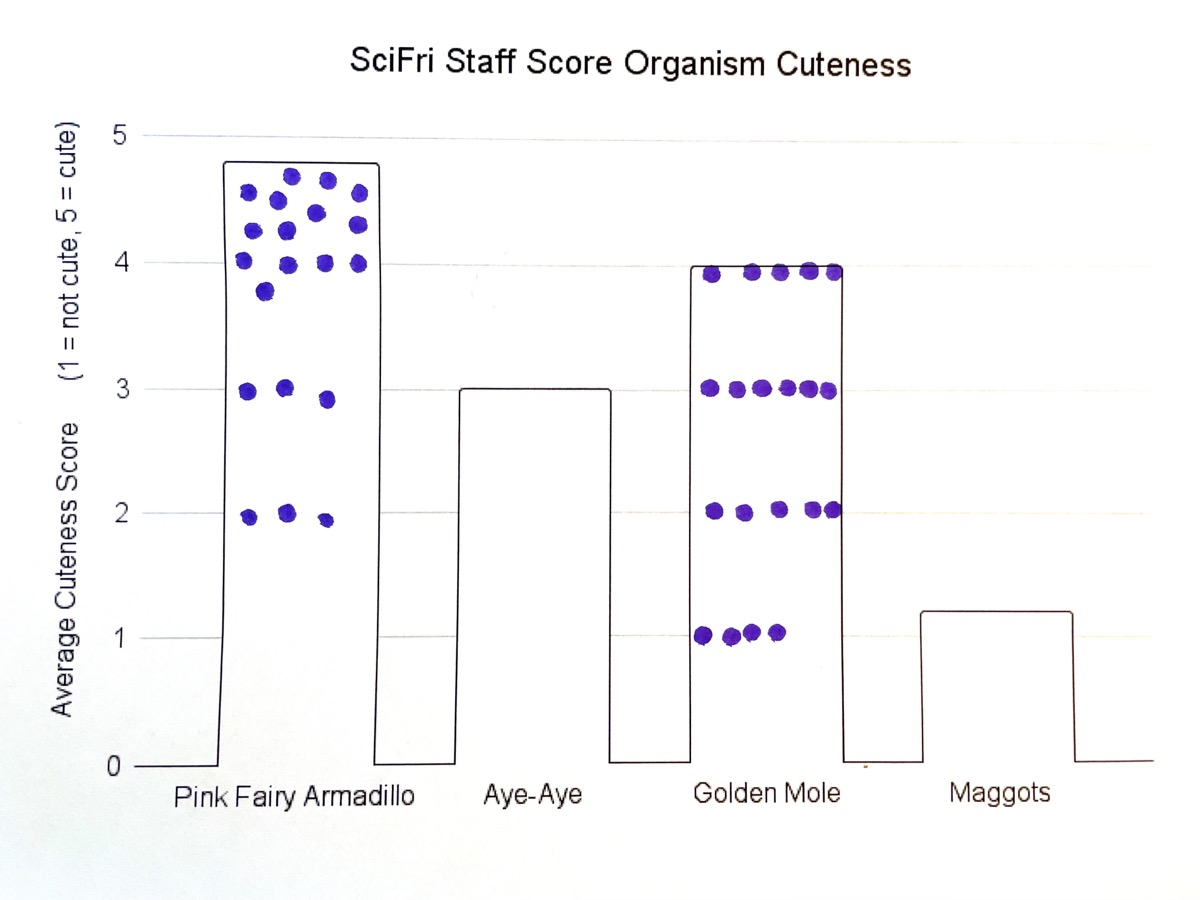
When Kerns and Wilmer issued a similar challenge, they found that the bar graph sketches made by study participants fell into two camps: Sketches either illustrated an accurate interpretation of an average, with data points both above and below the top of the bar, illustrated as figure A above, or they showed data points at or below the top of the bar, what they call a Bar-Tip Limit (BTL) error, illustrated in figure B above.
When a graph reader confuses a bar graph of averages as representing counts, they incorrectly restrict individual data to inside the bar, an error made by about one in five study participants.
Invest in quality science journalism by making a donation to Science Friday.
Jeremy Wilmer is an associate professor of Psychology at Wellesley College and founder of ShowMyData.org.
Sarah Horan Kerns is a research associate in the Psychology department at Wellesley College in Wellesley, Massachusetts.
IRA FLATOW: This is Science Friday. I’m Ira Flatow. If you hate bar graphs, you are not alone. Bar graphs are one of the simplest ways to represent data. The longer the bar, the bigger the number it represents. Easy, right? Well, not so much. Especially if each bar represents an average not a total count now it gets a bit tougher.
And because bar graphs are everywhere, psychologists from Wellesley College wanted to determine how well people can actually read and interpret bar graphs. You know where this is headed. Turns out one in five people in their study misunderstood the data the bar graphs intended to show. Sometimes it may take thousand words to explain a picture.
Joining me now to talk more about their bar graph research are my guest, Jeremy Wilmer, associate professor of psychology at Wellesley and Sarah Horan Kerns, research associate in the Psychology Department at Wellesley College based in Wellesley, Massachusetts. Welcome to Science Friday.
JEREMY WILMER: Thanks, Ira.
SARAH HORAN KERNS: Thanks so much for having us.
IRA FLATOW: Sarah, it looks like in some kinds of bar graphs, the graph is not so intuitive and that’s what you wanted to study. What was the purpose and how did you go about studying it?
SARAH HORAN KERNS: So we started our paper with a joke, which is two graphs walk into a bar. And it summarizes the study question really well. One of the easiest ways to confuse people is to use the same symbol to mean two different things. So a hexagonal sign that’s red means stop, but what if it also meant drive really fast when it rains. Those two meanings would be really confusing.
A common place where one symbol is used to express two different ideas is with bar graphs. So in a bar graph, a bar could represent a single number like a count or a stack five iguanas, three minivans. It’s a single data point. Or it could represent a mean, which is a summary statistic. Average home prices, average antibody response. It’s more abstract. A summary representation of the data.
So when we have two graphs walking into one bar, does it cause confusion? That’s what we wanted to study. And we found out that it does. One in five people a full 20% confuse the two. They see a bar that represents an average and they think it’s a count. And that holds across all ages, gender, country of origin level of education. It was a pretty surprising finding.
IRA FLATOW: That is interesting. Jeremy, tell me how you tested this study and how you found out how difficult it was for people to interpret the bar graphs?
JEREMY WILMER: So we used a really low tech approach. We had people look at a real bar graph from a real interest textbook. And they pulled out a pencil and a piece of paper and we had them sketch the graph and with its mean values and then add in individual values that in their best guess were the ones that would have been averaged to create those mean values.
It’s a way to take what’s in one’s head and make it nice and concrete so you can see it. One in five people put all of the dots inside the bar as if everybody is below average, or as if there’s a stack of data representing a single number rather than an average that’s in the middle of the data.
IRA FLATOW: So if they were to do it correctly because it’s an average, there should be some dots above the graph and some dots below the bar.
JEREMY WILMER: Yeah.
IRA FLATOW: And they didn’t do that and they didn’t understand that?
JEREMY WILMER: Right. Yeah.
IRA FLATOW: And so why did a fifth of the people make the same mistake? Do you have any idea?
SARAH HORAN KERNS: I think it’s because they don’t grasp the mean. So mean just means average. But if we’re talking about one of my previous examples which was antibody response. Two people get a vaccine, one body produces a lot of antibodies and the other not so much.
And so if you look at just the data points, you can see those two separated points. But if you look at the average of those two, at some point in between them that actually isn’t one of the data values at all. And that abstraction can be confusing about the actual data.
IRA FLATOW: And is that what made you want to study bar graphs because it is confusing?
SARAH HORAN KERNS: So there are a lot of graphs being thrown at us every day. And when people and even organizations are trying to make evidence-based decisions using the data that they’ve seen.
If two people look at the same graph and come away with wildly different understandings of the data, when they try to apply the facts to the issues that they’re trying to address, they’ll be talking about two entirely different fact patterns. And how can you have an evidence-based decision essentially without any evidence. You don’t have an agreement on what the evidence is.
JEREMY WILMER: One of the reasons that bar graphs of mean values are so ubiquitous in education, and in science and other areas is that they feel simple. They’re just representing, showing us a single number but in fact they’re also very abstract. There’s this push and pull where abstraction often confuses people, but simplicity is often helpful. So we wanted to see basically which one of those two things won in terms of understanding.
IRA FLATOW: Well, what if you did away with the bar itself and just put all those dots on the graph instead. Do people understand that better, Sarah.
SARAH HORAN KERNS: Yes. They do. And in fact, that’s one of our strong recommendations is to show individual data points in whatever graph that you use. Be concrete.
IRA FLATOW: Well, wouldn’t it be better then to do away with the bar itself, Sarah and just show all those scatter points on the graph?
SARAH HORAN KERNS: Yes. I really think that it would at the very least. I think that we should step back from using bar graphs to represent means.
IRA FLATOW: And so what graph would be better?
JEREMY WILMER: So here’s a little thought experiment. Imagine two flocks of birds, hundreds of birds in each flock. And imagine that the two flocks are crossing over each other and weaving in and out. The entire time we’re looking at those flocks, the human visual system is very expert at guessing roughly how many birds are in each flock, separating the two flocks even when they’re overlapping with each other. Having a sense of where the center bird is in each flock.
These are things we do effortlessly and very easily. I think we can do the same thing with our graphs. We create a couple of flocks of birds, a couple collections of data points, show people every single one of those data points.
Remember, especially in human data. Each one of these data points represents a human being. And I find with my students once they see all the data, their minds just start churning. Oh, well, what about that one and that one. Oh, look. I wonder what that person was thinking or doing.
IRA FLATOW: But can we go overboard sometimes? I’ve seen some really complicated charts and maps and graphs where it looks like people are trying to be more artistic and creative than actually helping us understand what the data says. Do you find that true?
JEREMY WILMER: Yeah. Well, this is where science meets art. There are certain design principles that are well-known to take even relatively complicated things or relatively information packed things and make them very understandable.
We can think about a Google map. Just think of the large number of pieces of information that are in a Google map yet we can read it very easily. We just have to carefully design things to take advantage of the human visual system strengths and not to push on its weaknesses.
IRA FLATOW: Because I know that you’re a big advocate for data literacy and you’ve included data literacy lessons in your undergrad psychology classes. How do you go about teaching them to better understand how data works?
JEREMY WILMER: So I take these methods we used in this study right into the classroom. I have the students take their predictions and hypotheses and draw them on paper. The first step is comparing them to each other and noticing, oh, my gosh my prediction or my interpretation differs from the three or four people sitting around the same table.
And then we look at the real data and we compare all of their guesses about the data to the real data. And that’s where real learning happens. I think the most important thing that I can give to my students as a professor of psychology is a real direct understanding of what real human data looks like.
IRA FLATOW: Interesting. How early do you think kids should be learning about graphs? Maybe we shouldn’t wait till they get to high school or college?
SARAH HORAN KERNS: Well, even now, graphs are taught in elementary. If you think about it, you’ve got the ice cream graph, where everybody who likes chocolate has a little cone and it’s stacked up, and everybody who likes vanilla. And those are count bar graphs.
The problem comes in when abstraction causes confusion. So even when they’re really young, getting students working with individual data, fiddling around with graphs. Having children develop good intuitions about data.
IRA FLATOW: Interesting. And Jeremy I know you’ve created something called the showmydata.org. What is that all about?
JEREMY WILMER: So showmydata.org is designed as a free open access suite of data visualization tools that allow it to be really easy to make best practice graphs, really quickly just by copy pasting from any spreadsheet, a Google Sheet or an Excel workbook. Looking at the data in a spreadsheet, it’s easy for one’s eyes to glaze over but being able to copy paste it into a form where you can examine the individual data points is really useful and educational.
IRA FLATOW: And I hear that you’ve hired a couple of quality control agents to determine– your seven and 11-year-old kids to see if that’s working out?
JEREMY WILMER: Yeah, that’s right. Patrick and Donald they are my prime research and development team. They’re great critics, they tell it like it is. And if it works on Patrick and Donald, then I think it has at least a fighting chance of working on my college students.
IRA FLATOW: I love it. Sarah, what’s next for your research?
SARAH HORAN KERNS: So actually we’re in the process of finishing up research on another paper coming out that discusses people’s understanding of data and uses the same drawing method. We wanted to investigate what other misunderstandings people had about bar graphs and the data that comprises them.
And we found that in this study people don’t have good intuitions about the distribution how even or uneven the data is, or about really extreme values.
JEREMY WILMER: And one of the major findings from that new piece of work is that often people when they’re thinking about the spread of the data, they imagine that there’s no overlap between two different groups. So imagine two different treatments for example for some sort of illness. And so people will see two different means.
And a lot of folks will imagine that every single person who got the treatment did better than every single person who didn’t get the treatment. And in most domains of life that’s a little too overoptimistic, there’s some folks who got the treatment who did a little less well, and there’s some folks who didn’t get the treatment who ended up doing just fine.
We think one of the implications of that new piece of research is to help people to more carefully and accurately gauge what is the benefit, and for how many people is this benefit? Again, thinking at the individual level about individual human beings.
IRA FLATOW: Yeah. Very good way to wrap it up. And I want to let our listeners know if they want to see some examples of the bar graphs used in the study. They can go to our website sciencefriday.com/bargraph. Thank you both for taking time to be with us today.
JEREMY WILMER: Thanks so much, Ira.
SARAH HORAN KERNS: Thanks so much for having us.
IRA FLATOW: Jeremy Wilmer, associate professor of psychology at Wellesley College and Sarah Horan Kerns, research associate in the Psychology Department there at Wellesley in Wellesley, Massachusetts.
Copyright © 2022 Science Friday Initiative. All rights reserved. Science Friday transcripts are produced on a tight deadline by 3Play Media. Fidelity to the original aired/published audio or video file might vary, and text might be updated or amended in the future. For the authoritative record of Science Friday’s programming, please visit the original aired/published recording. For terms of use and more information, visit our policies pages at http://www.sciencefriday.com/about/policies/
Shoshannah Buxbaum is a producer for Science Friday. She’s particularly drawn to stories about health, psychology, and the environment. She’s a proud New Jersey native and will happily share her opinions on why the state is deserving of a little more love.
Ira Flatow is the founder and host of Science Friday. His green thumb has revived many an office plant at death’s door.