Grade Level
6 - 8
minutes
1- 2 hrs
subject
Physical Science
stem practices
Analyzing and Interpreting Data
Activity Type:
engineering and design challenge
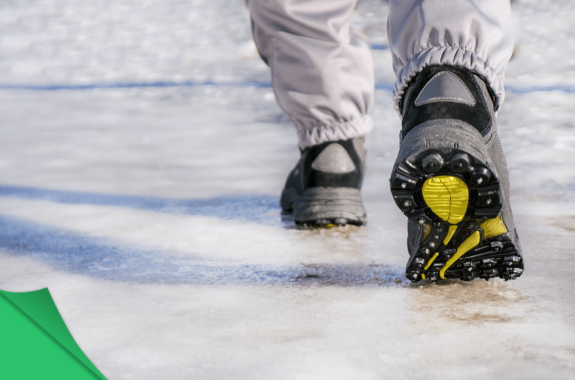
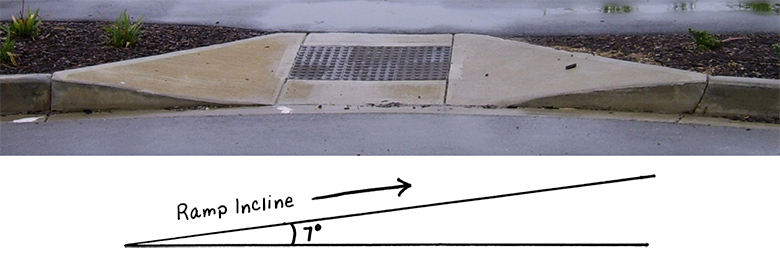
Even in our best winter boots, we often slip and slide on icy sidewalks. Researchers at the Toronto Rehabilitation Institute noticed this problem and decided to investigate just how resistant winter boots are to slippery conditions. They tested more than 100 boots on an icy incline and found that only about 10 percent enabled the wearer to walk up a seven-degree slant without slipping.
How can we create a better winter boot?
Check out the researchers’ data on their site Rate My Treads. The “snowflake scale” indicates how well a boot gripped the ice. Are you surprised by some of the shoes on this list that didn’t stand up to the test?
How can we redesign a shoe that earns a three-snowflake rating on the snowflake scale? In this activity, you will investigate some of the factors that affect a shoe’s ability to grip icy surfaces, then use your new knowledge to improve a shoe’s traction.
Let’s take a closer look at our shoes.
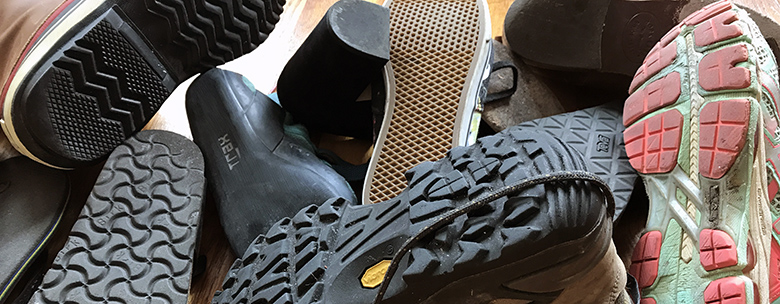
Grab at least four different shoes from the closet. Sort them into groups based on what they’re used for. Notice the diversity of tread pattern and material. As you examine the shoes, consider their purpose. Think about what makes each shoe unique.
- What are these shoes designed for? (E.g., basketball, running, cold weather, warm weather, etc.)
- What do you notice about the tread patterns?
- Why would different types of shoes need different treads?
- What about each shoe’s tread makes it suited to the surface you would wear it on?
Why do we slip on ice?
In most cases, your shoes make a firm connection with the ground, while in others—like when you’re walking on ice—your shoes slide much more easily. What contributes to your grip on a surface? Whether you slip or walk easily across terrain has a lot to do with friction, a force that opposes the motion of surfaces in contact with one another.
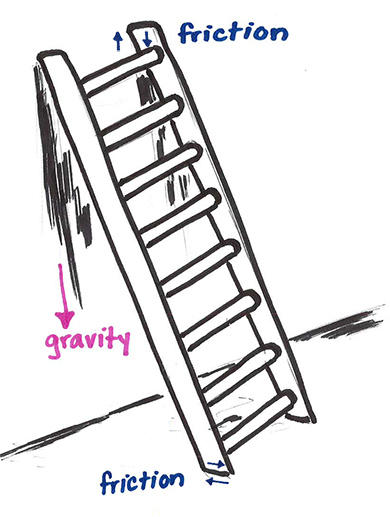
We encounter friction every day, all around us. It’s one of the forces that slows a rolling ball to a stop and keeps a ladder leaned against a wall. Often, we can detect friction by the energy that it gives off as heat. If you quickly rub your hands together, you should feel warmth. That’s caused by friction.
The amount of friction that exists between two objects depends in part on how easily their surfaces move against each other, a measure called the coefficient of friction. Try sliding on a wood floor in socks and then sliding across a carpet in socks. Notice the difference? The coefficient of friction between your socks and the wood floor and between your socks and the carpet are different.
Generally, when smooth surfaces are in contact with each other, the coefficient of friction is lower, which indicates slipping and sliding. Between rough surfaces, the coefficient of friction is higher, meaning better traction.
Which scenario will have the higher coefficient of friction: a cardboard box moving across the asphalt, or a cardboard box moving along a polished wood floor?
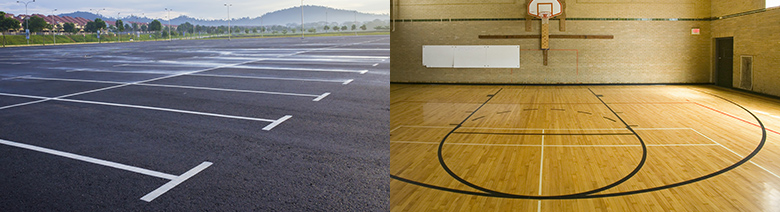
If you said a cardboard box on asphalt would have a higher coefficient of friction, you’re right. The smooth wooden floor provides less friction against the cardboard box, and therefore the coefficient of friction is lower.
Even surfaces that seem really smooth to our naked eye can appear surprisingly rough and uneven under high-powered microscopes, and can contribute to friction when we walk across them. That’s why you eventually come to a stop when sliding across a wood floor in your socks!

Let’s take a closer look at ice.
Listen to the audio clip below. Here, physicist Robert Carpick describes why ice is slippery.
Why does walking on ice feel different from walking on other surfaces?
Like Carpick says, the surface of ice is very different from other surfaces we’re familiar with. Scientists think that what makes ice slippery is a microscopic layer of water on the surface.
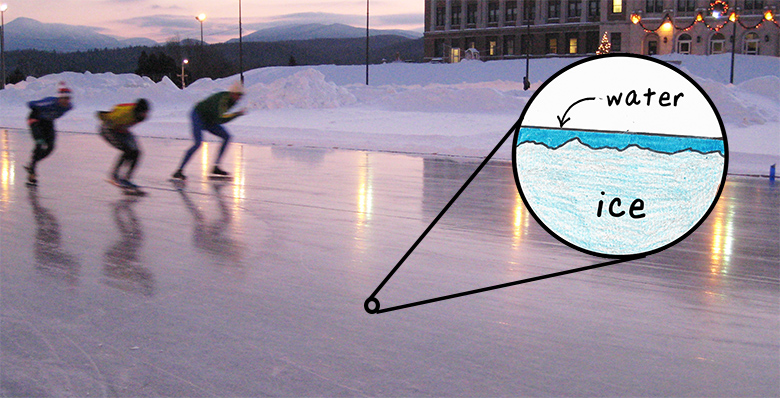
Think back to when you slid on the smooth wood floor in socks. Now imagine adding marbles beneath your feet. They would make the wood much more slippery, right? Those marbles are somewhat like the liquid layer on the surface of ice.
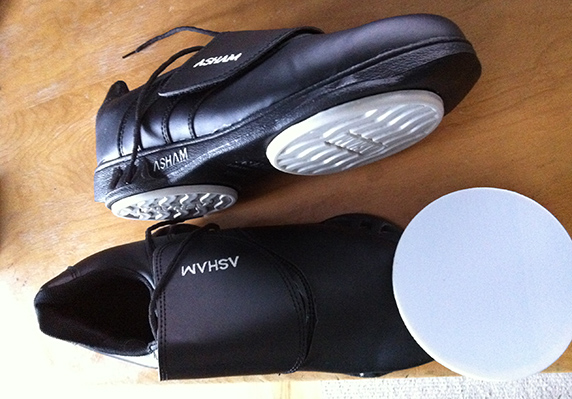
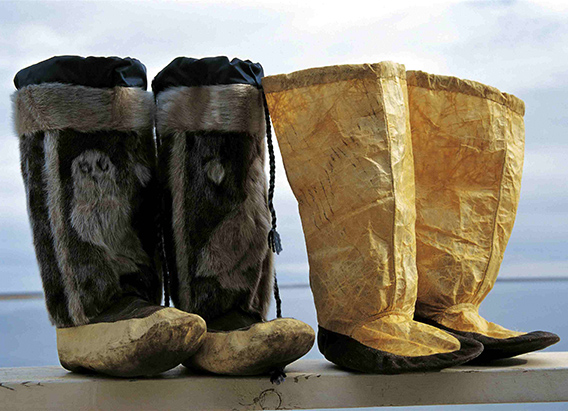
The slip factor between your shoe and ice requires some special design consideration. Let’s take a look at the shoes worn by people who spend a lot of time on ice, such as curlers, mountaineers, and indigenous peoples. While viewing the images, record observations of each shoe (i.e. tread, materials) on a sheet of paper.

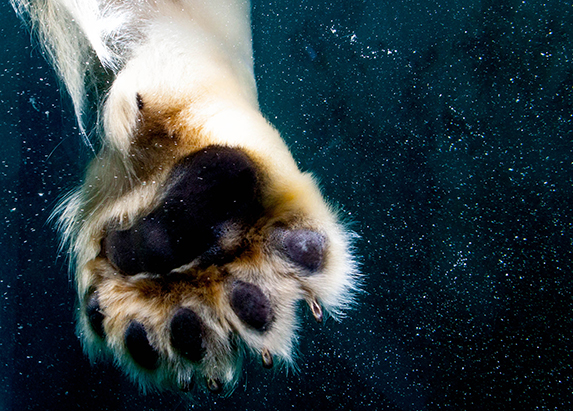
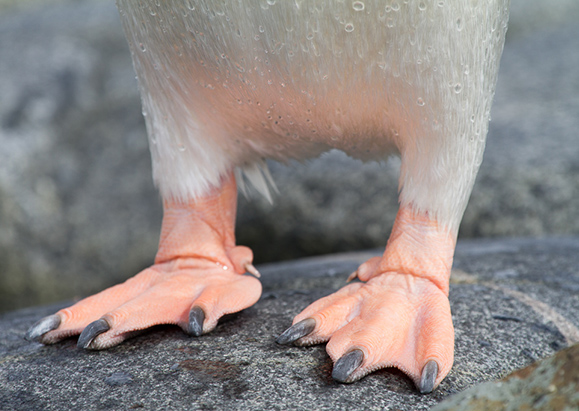
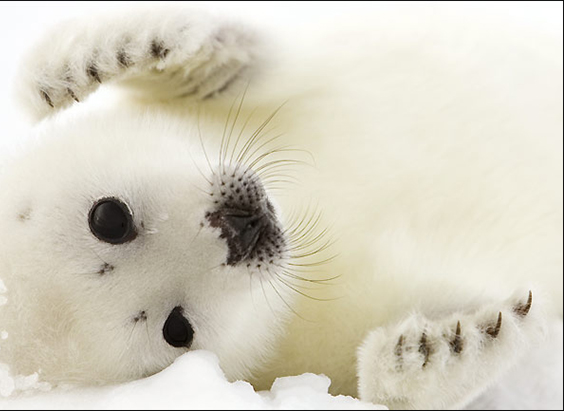
How do animals walk on slippery ice?
Let’s explore some of the adaptations animals have evolved to navigate slippery ice. While looking at the images, add observations underneath your shoe notes. Consider the following questions:
- What kinds of features or textures do you notice?
- Do any of the animal features—fur, claws, or bumpy pads—remind you of what you saw in the mukluks, curling shoes, or microspikes?
- What surfaces is the organism traveling over?
- Are there ideas or structures you could imitate to improve your own shoes?
Design a better shoe.
In the tests done by the Toronto-based team for Rate My Treads, only nine boots out of nearly 100 could handle a seven-degree incline without slipping. You are going to conduct two tests to identify how sole material and tread surface area affect friction on ice. Then you will use your data to redesign or adjust a sole to improve its grip on ice.
Investigation 1: Does sole material affect friction?
In the following investigation, you’ll cover shoe print cutouts with three different types of material. Then you’ll test how well each model grips a wooden ramp by calculating its speed as it slides down.
Materials
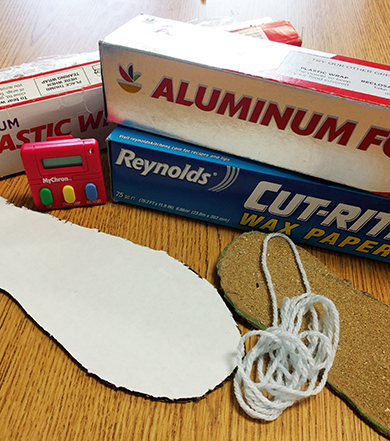
- Cardboard or card stock for shoe print
- Shoe Print Template
- Adhesive materials: duct tape, masking tape, hot glue, rubber bands, string, etc.
- Sole materials: You can use any on-hand materials from your classroom or household. Some recommended materials include sand, sand paper, salt, recycled materials, wax, Brillo pads, shelf liners, cling wrap, aluminum foil, wood scraps, fabric scraps, etc.
- Scissors
- Stopwatch
- Rulers or measuring tape
- Wooden ramp (at least three feet long)
- Shoe weight (at least 250 grams, created from weights, bags of sand or flour, paper weight, etc.)
- Materials Worksheet
Testing Protocol
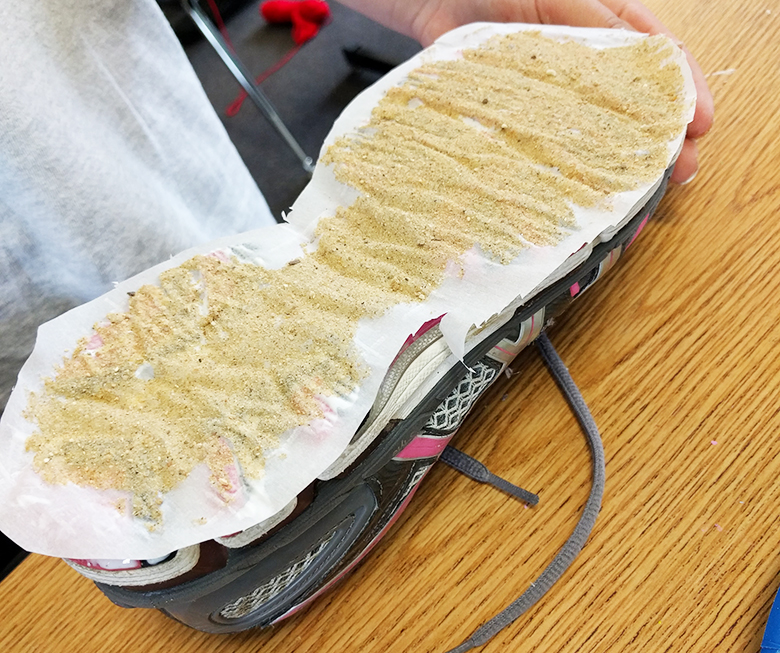
Prepare your models
- Create three shoe prints from card stock or cardboard using the template provided.
- Select three different materials to use for your soles. As you make your choices, examine each material. What are some of its characteristics (e.g., texture, weight)? How does it compare to animal adaptations and shoes designed for ice? What do you think would happen if you slid this material on ice?
- Cover the entire bottom of each shoe print in one of your chosen materials. It is important that the material covers the entire sole.
Test your models
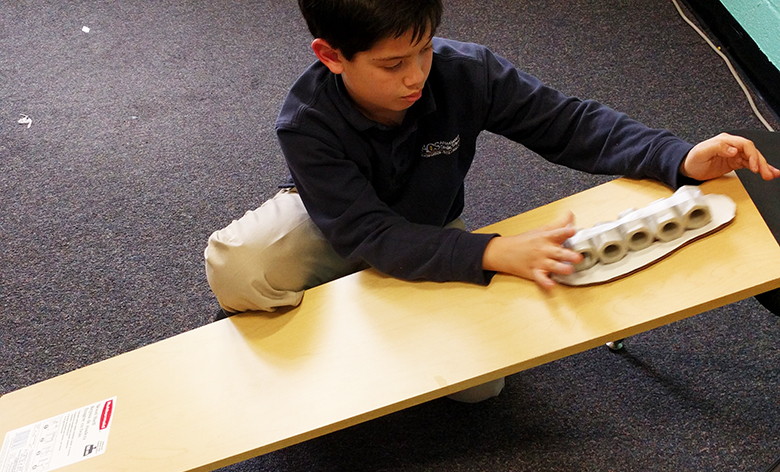
- Attach a weight to the top of one model. (It’s important that the same weight be used in each test.)
- Position the model at the top of the wooden ramp. Let the model slide down the ramp, and time its descent. Make sure you start the timer as soon as you release the model and stop it when the model hits the ground.
- Calculate the speed of the model using the formula Speed = Distance/Time. (Find the distance by measuring the length of the ramp, in meters.)
- Record your result in the table on your Materials Worksheet.
- Repeat Steps 1-4 for each model.
- Create a bar graph of your results on your Materials Worksheet.
Analysis Questions
— Which material caused the model to travel the fastest?
— Which material caused the model to travel the slowest?
— Based on your data, how does each material that you tested affect friction?
Remember, a slower speed indicates an increase in friction.
Investigation 2: Does tread surface area affect friction?
In this investigation, you’ll apply three tread patterns with different surface areas to shoe print cutouts. Once again, you’ll test how well each model grips a wooden ramp by calculating its speed as it slides down.
| Materials | |
|---|---|
|
|
Testing Protocol
Prepare your models
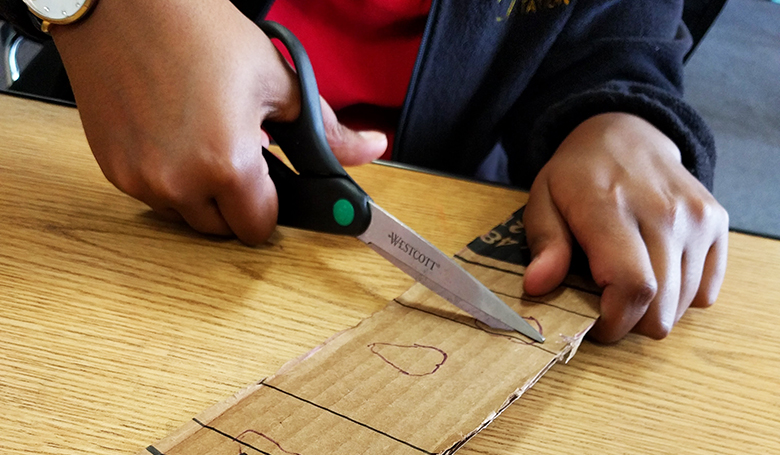
- Make three more shoe prints from card stock or cardboard, using the template or your own shoe.
- Cut out various shapes of different sizes from cardboard. These pieces will be used to create treads.
- Create three shoe soles with distinctly different tread patterns. One shoe should have a tread pattern with a small surface area (meaning that very little of the tread would come in contact with the ground). Another should have a large surface area (meaning that lots of the tread would come in contact with the ground). And the last tread pattern should fall somewhere in the middle.
- Glue the shapes to the bottom of each shoe print. Be sure the shapes do not extend past the edges of the cutout.
How did you ensure that your designs represent three different surface areas?
Test your models
- Attach a weight to the top of one model. (It’s important that the same weight be used in each test.)
- Position a model at the top of the wooden ramp. Let the model slide down the ramp, and time its descent. Make sure you start the timer as soon as you release the model and stop it when the model hits the ground.
- Calculate the speed of the model using the formula Speed = Distance/Time. (If you used the same ramp as in the previous experiment, use the same length for distance.)
- Record your result in the table on your Surface Area Worksheet.
- Repeat Steps 1-4 for each model.
Determine the surface area of your treads
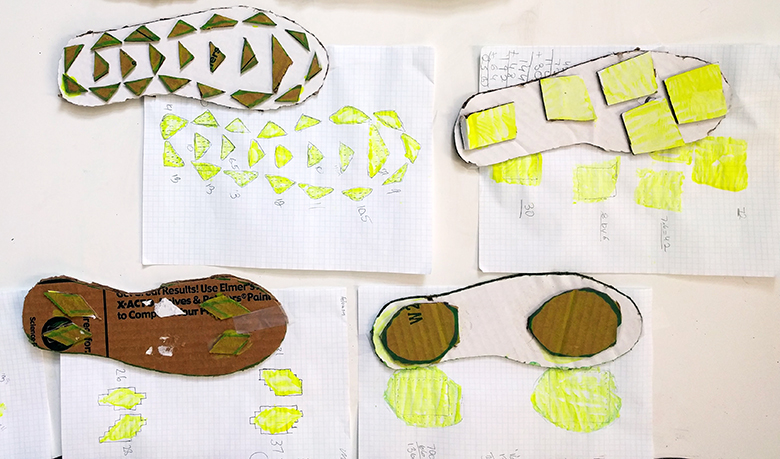
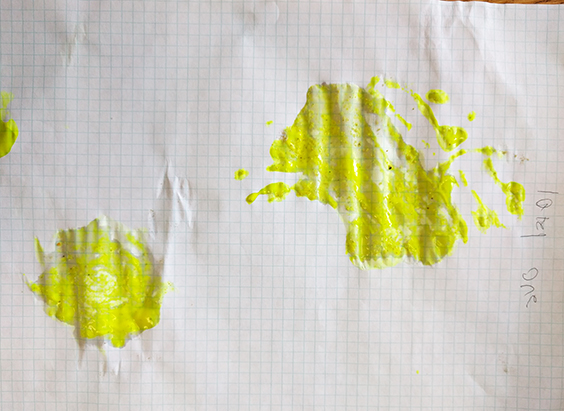
- Using paint, coat the bottom of one model. Press the paint-coated side to a sheet of 1-cm graph paper.
- Count the squares that are filled with paint to estimate the surface area of the tread.
- Record the surface area on your Surface Area Worksheet.
- Repeat Steps 1-3 for each shoe model.
- Create a line graph of your results on your Surface Area Worksheet.
Analysis Questions
— Which model traveled the fastest?
— Which model traveled the slowest?
— Based on your data, are there any general observations you can make about the relationship between surface area of the tread and friction?
Use your data to make a better shoe.
Now that you have investigated the impact of sole material and tread surface area on shoe grip, you can use your data to help you create a winter shoe (or boot) design that grips the ice instead of sending you tumbling.
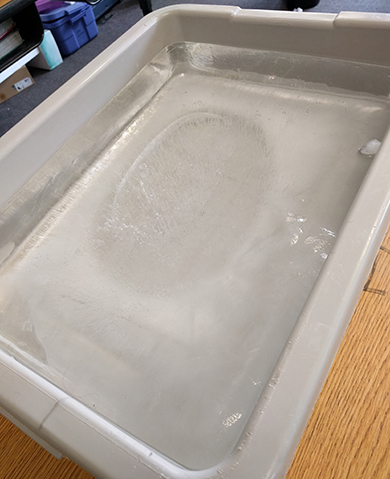
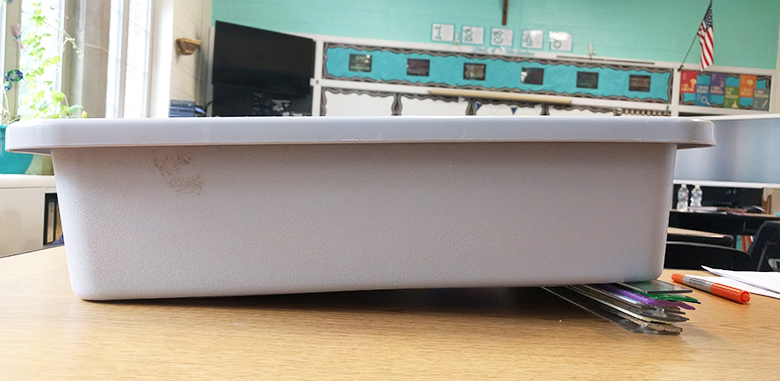
Prepare an ice test ramp.
You will need to prepare an ice ramp at least one full day before testing. Find a large tray or shallow container that is at least 18 inches in length. Fill the tray with water and freeze it for at least 24 hours. The deeper the tray, the longer the water will take to freeze. On test day, remove your tray from the freezer, and use a protractor to prop it up to a seven-degree incline on common household materials such as marker boxes, notebooks, or books.
Materials
- Design materials: You can use any on-hand materials from your classroom or household. Some recommended materials include sand, sand paper, salt, recycled materials, wax, Brillo pads, shelf liners, cling wrap, aluminum foil, wood scraps, fabric scraps, etc.
- 1 used, disposable boot or sneaker (if you don’t have a boot, use a shoe print cutout)
- Adhesive materials: duct tape, masking tape, hot glue, rubber bands, string, etc.
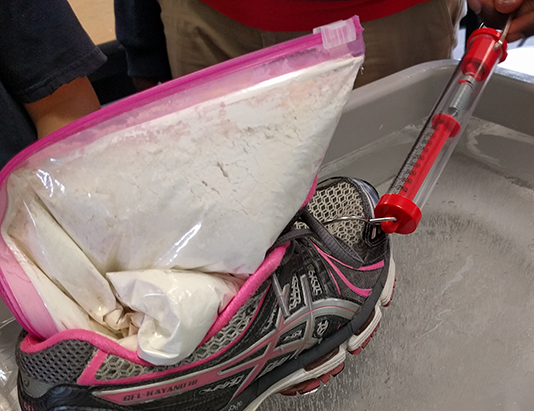
- Shoe weight (a bag of flour or sand works best for this step)
|
|
Preliminary Testing
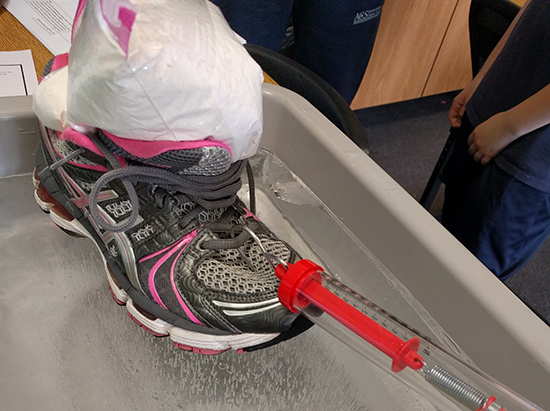
First, you’ll test your unmodified shoe’s grip on the ice ramp. Prop the ice ramp up at a seven-degree incline. Follow the steps of the testing protocol below for each test.
Reflect on your preliminary data.
- What features contributed to your unmodified shoe’s grip on the ice?
- Compare your unmodified shoe to shoes designed for use on ice, and to adaptations that animals have evolved for moving on ice. What similarities and differences do you see?
- What changes can you make to your shoe using what you learned about nature, shoes designed for ice, and the data you collected earlier?
Redesign your shoe.
Challenge
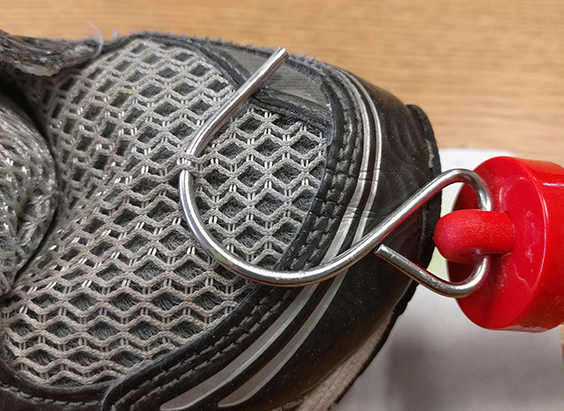
Using common classroom or household materials, redesign the sole of your shoe to increase the friction and the force needed to pull it. Your modification cannot add more than one inch in height to the shoe and must be no larger than the sole of the shoe. Use your data from the sole material and tread surface area investigations to guide your design process.
Imagine
Brainstorm ideas for your design by sketching them out on the Engineering Design Worksheet. Think big and be creative!
— What qualities do shoes designed for ice have that you could replicate?
— Think about the results of your tests on sole material and tread surface area. Could you mix and match the designs you came up with?
— What will the bottom of this shoe look like?
— How much of the shoe will come in contact with the ice?
Plan
Select the best design elements from your brainstorming, and sketch them into a blueprint that you will use to build your shoe. Your blueprint diagram should include a profile view of your sole in contact with the ice as well as a view of your tread pattern.
— Which elements of this design do you think might improve your shoe’s grip on the ice?
— How does your design draw from your previous sole material and tread surface area tests?
— Explain what you would expect to see at the microscopic level when this newly designed tread comes in contact with the ice.
Build
Using your chosen materials and blueprint, build your new sole.
Test
Follow the testing protocol you used to test your unmodified shoe. Record your results on the Engineering Design Worksheet.
Improve Your Design
Want to continue improving your design? Try changing a single feature at a time, testing each change to see how it affects the interaction between the sole and the ice. Track the changes you made on your Engineering Design Worksheet. Which changes had the greatest impact on the grip of your shoe on the ice?
Communicate
Create a mini poster presentation of your design to share with your classmates. In your presentation, include your graphic data, prototypes, and surface area tread prints.
Compare your designs.
Now that you have designed your shoe, let’s see how your findings compare to the research collected by the Toronto scientists. Researcher Barry Westhead, who led the team, describes how shoe design is progressing, and the materials that scientists are currently testing.
— Does your design reflect any features of today’s cutting-edge designs?
— Now that you’re familiar with what shoe designers and researchers are currently investigating, how would you further modify your design?
— What are some of the limitations you had that a real shoe designer wouldn’t have?
— How could your design be used in a shoe developed by experts?
Next Generation Science Standards And Notes From The Field
Next Generation Science Standards
MS-ETS1-1. Define the criteria and constraints of a design problem with sufficient precision to ensure a successful solution, taking into account relevant scientific principles and potential impacts on people and the natural environment that may limit possible solutions.
MS-ETS1-2. Evaluate competing design solutions using a systematic process to determine how well they meet the criteria and constraints of the problem.
MS-ETS1-4. Develop a model to generate data for iterative testing and modification of a proposed object, tool, or process such that an optimal design can be achieved.
SEP: Asking questions and defining problems, Constructing explanations and designing solutions
DCI: PS2.A: Forces and Motion, PS2.B: Types of Interactions
CCC: Cause and Effect, Stability and Change
Influences of Science, Engineering, and Technology on Society and the Natural World
Common Core State Standards
MP.2 Reason abstractly and quantitatively.
SL.8.5 Include multimedia components and visual displays in presentations to clarify claims and findings and emphasize salient points.
WHST.6-8.7 Conduct short research projects to answer a question (including a self-generated question), drawing on several sources and generating additional related, focused questions that allow for multiple avenues of exploration.
Teachers who field tested this resource had the following advice for teachers adopting this resource:
Sri from New Jersey said: Make sure that the students record the data during the first two activities and motivate them to use it in the third (finale) activity. Have a discussion with students on why they think their designs worked in a particular fashion. What would they modify if given a second chance? Why?
Educator's Toolbox
Meet the Writer

About Brienne May
@MrsMay_ScienceBrienne May is a special education teacher in Pittsburgh, Pennsylvania. Her favorite kinds of lessons inspire kids to solve real-world problems (like her SciFri resource!); engage in scientific debate; and get their hands dirty through activities like gardening, engineering projects, and animal dissections.