Grade Level
6-12
minutes
Multi-day
subject
Life Science, Earth Science
Activity Type:
lab simulation, analyze and interpret data, archaeology, paleoethnobotany
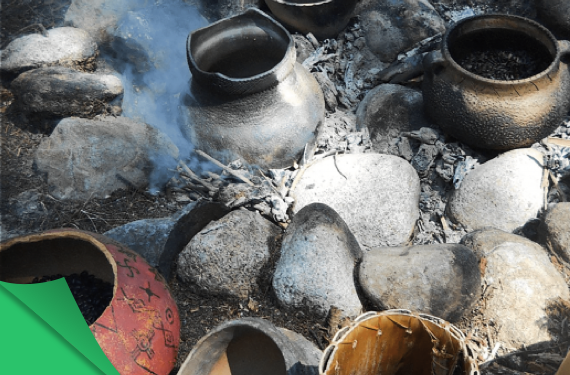
![]() Imagine a family sitting next to a fire pit in a small village 1,000 years ago. It’s late autumn, and they’re cooking pots of food with plants that they grew and foraged. There is a strong aroma of corn and pumpkin, and also hints of wild rice and cranberries. One of the pots breaks at the edge of the fire pit, and its contents spill into the flames. But all is not lost! There is plenty of food left for a feast. The family finishes their meal and puts their trash in the fire pit. They are leaving for their winter camp and will make a new fire pit when they return next spring. Eventually, the fire pit with the spilled meal and food trash becomes buried in the dirt and forgotten in time.
Imagine a family sitting next to a fire pit in a small village 1,000 years ago. It’s late autumn, and they’re cooking pots of food with plants that they grew and foraged. There is a strong aroma of corn and pumpkin, and also hints of wild rice and cranberries. One of the pots breaks at the edge of the fire pit, and its contents spill into the flames. But all is not lost! There is plenty of food left for a feast. The family finishes their meal and puts their trash in the fire pit. They are leaving for their winter camp and will make a new fire pit when they return next spring. Eventually, the fire pit with the spilled meal and food trash becomes buried in the dirt and forgotten in time.
Fast forward to today where archaeologists are excavating the village, which is now an archaeological site. They see a circle of stones, dark soil, and traces of ash from a fire burned long ago. But what about that meal that was spilled into the fire 1,000 years ago?
In this activity, students will simulate a simple but effective technique that archaeologists use to find ancient plant remains and will compare their findings to real archaeological data to make interpretations about food and diet.
“The Black Burned Bits Of Prehistory”
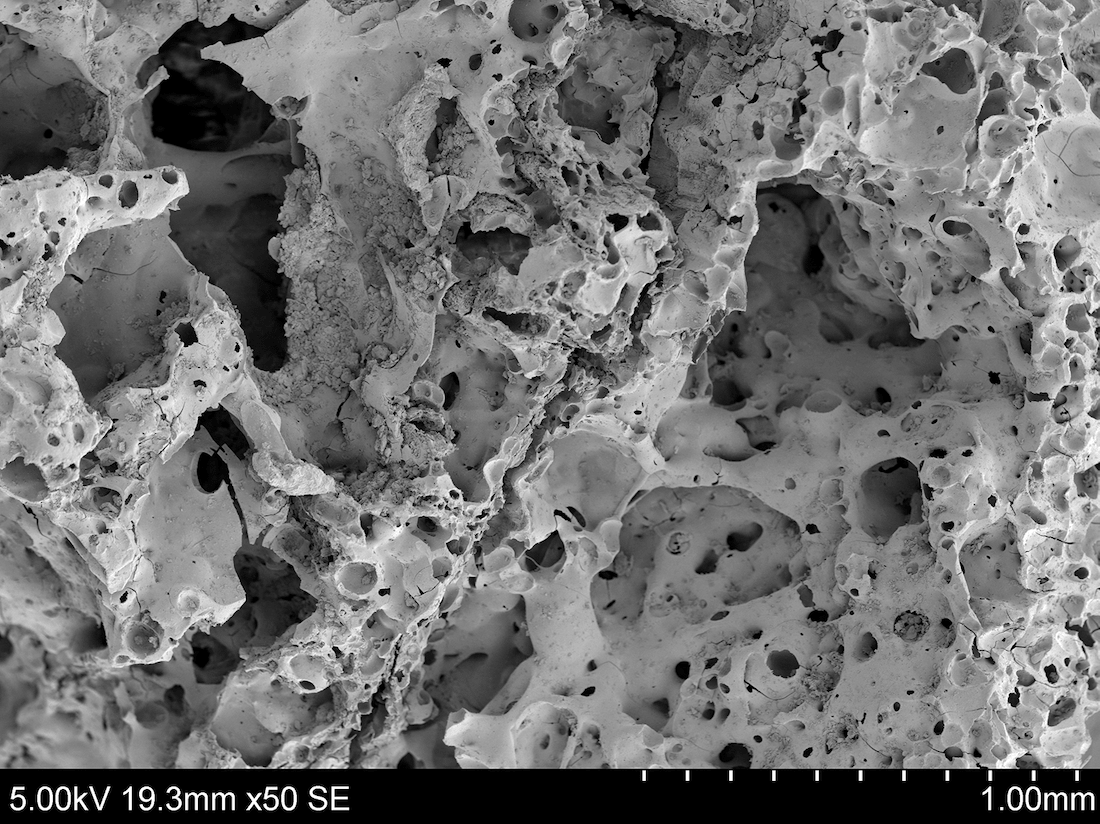
Plants decompose when they die. Environmental conditions influence the speed and extent of this decay. The organic soft tissue breaks down, and it is often the remnants of what humans in the past did not eat, such as hardy seeds or shells, that survive in the archaeological record. Plant fossils form in a similar way, but the plant evidence that these archaeologists are studying is not yet fossilized, it is burned or carbonized. Carbonization, the conversion of organic matter into carbon happens when plant remains are burned, such as in a hearth or cooking fire. The organic matter is consumed in the burning process, and only the carbonized parts are left. Once they are burned, there is no longer organic matter to decay, so the carbonized plant remains are more likely to be preserved for the archaeologist to find. Although some seeds and other plant foods are light enough to float on water, many still sink. However, when plant materials like seeds are charred or carbonized, some of those plant remains will float! Ancient plant remains are either macrobotantical, visible to the naked eye, or microbotanical, requiring magnification to examine. We’ll be focusing macrobotanicals.
Following The Burnt Crumbs To The Rise Of Bread
Archaeobotany
Archaeology is the study of the human past through material remains, and archaeological sites are places where there is physical evidence of past human activities. Excavations of sites are a part of the archaeological process that occurs after extensive preparation and background research. Archaeobotany is the study of ancient plant remains and how humans interacted with them, and it involves specialized recovery and analytical techniques. Many plants found at sites were available locally, so archaeologists can use this information to determine the seasons when people were using the site, the natural vegetation that was growing, and which plants people chose to use for food, medicine, construction, and fuel. Without evidence from plants, archaeologists would know significantly less about past humans, the environment, and climate!
We’ll be learning about a specialized plant recovery technique called flotation. Archaeologists began using flotation techniques because the standard mesh size on screens used to sift soil is too large to capture tiny plant remains. Before flotation, most evidence of small and fragile plant remains was tossed away! Flotation uses water and some sort of agitation to break away soil from other materials, like plants. If the plant remains are carbonized, they will float to the surface and archaeologists can collect them in a fine mesh sieve.
An archaeobotanist from Crow Canyon Archaeological Center explains archaeobotany and flotation.
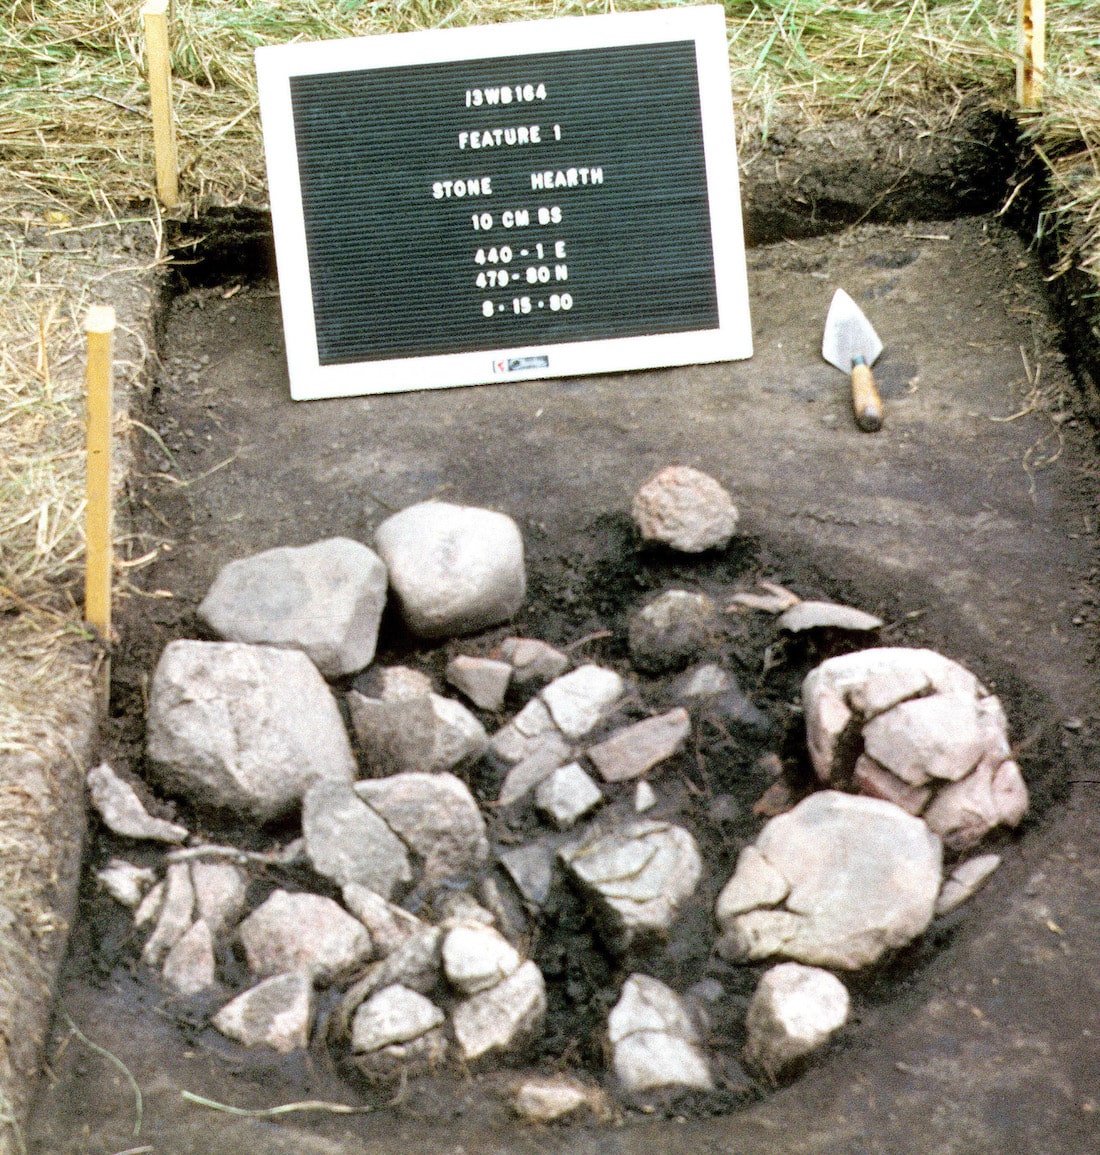
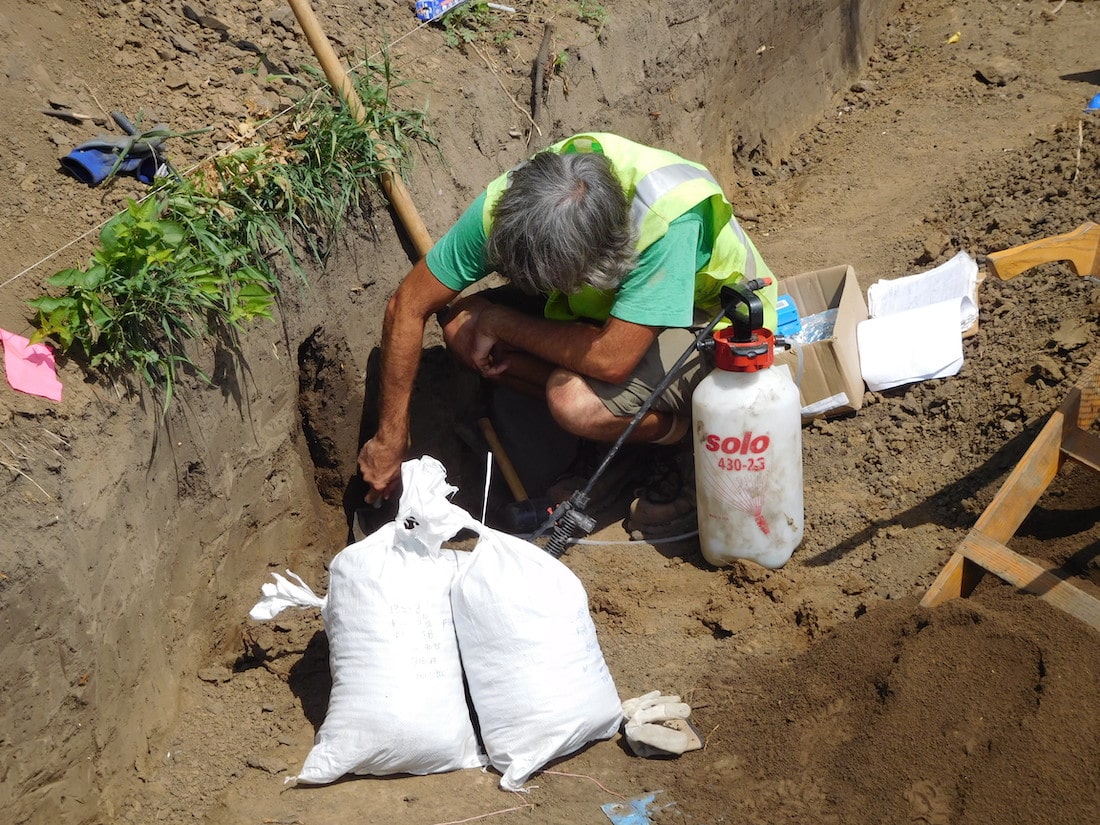
Archaeologists cannot search through all of the dirt while excavating, so they collect samples of the soil for flotation from carefully measured stratigraphic layers and features such as cooking hearths, middens or trash pits, storage or cache pits, and husking or food processing pits. During every excavation, archaeologists create a written catalog to record characteristics of the features, like their size and precise location within the site, and each feature is given a unique identification number in the catalog. Each soil sample taken from a feature is also carefully numbered and labeled so that archaeologists know the exact location it came from before taking it back to the lab for study. An archaeologist’s notes, catalogs, photographs, and drawings are the most important tools for making meaning of their findings because once something is excavated, its context is disturbed and all future studies rely on those notes.
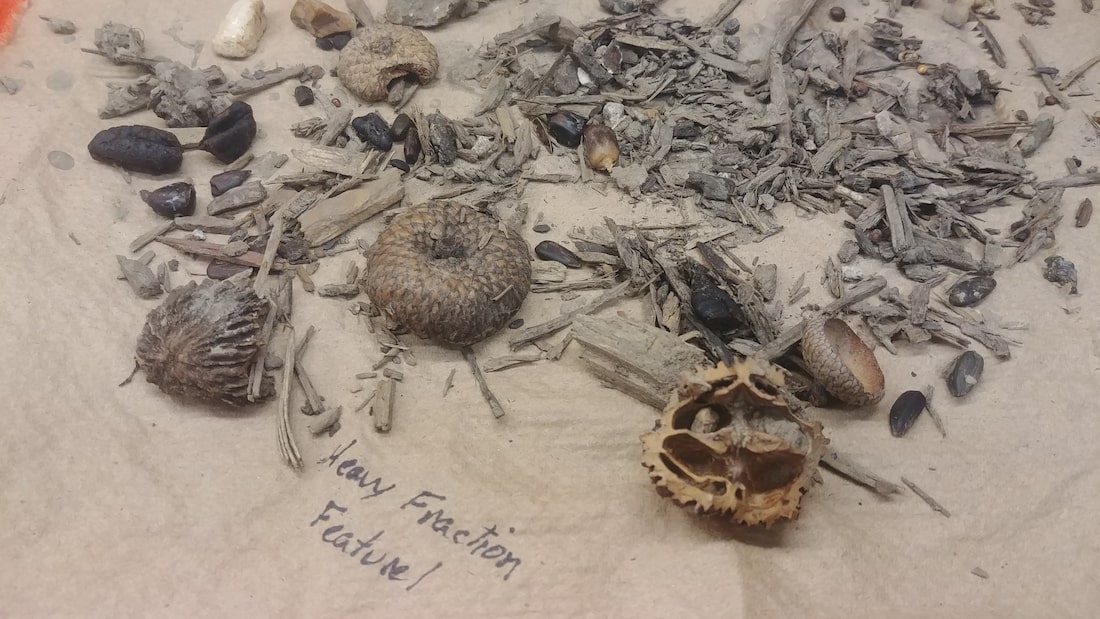
After a soil sample is floated, archaeologists have two sources of information: the light fraction, the lightweight plants and tiny burned bone fragments that float to the surface, and the heavy fraction, the dense remains like nut shells, stone flakes, or glass beads, that stay at the bottom. Each fraction must dry for a few days so its contents can be easily sorted. After sorting, archaeologists record the different types and frequencies of plant remains and compare the results to other soil samples and features to make evidence-based inferences about the diet of past humans.
When a flotation tank fills with water, the light fraction floats away and catches in a fine mesh screen, the heavy fraction catches in a larger mesh screen, and the waste dirt filters away. Animation by Jonathan Frier.
It’s important to note that not all archaeological sites produce evidence of plants used as food. The lifestyles of ancient peoples, the soils at a site, conditions for preservation, and the interests and techniques of the archaeologist all affect whether ancient plant remains exist, are preserved, and will be recovered.
Becoming Archaeobotanists
Archaeologists often perform basic flotation at remote sites with buckets, sieves, and running water. This same process can be done in the classroom! What plant remains will students find and how can they use this data and evidence to make inferences about human diet?
In the three activities described here, students will:
– Perform an authentic archaeological flotation technique to recover plant remains
– Sort and analyze their flotation samples to compile frequency data tables
– Synthesize their sample data into a larger classroom data set for analysis and discussion
– Compare their classroom data to authentic archaeological archaeobotany data
– Disseminate their findings as a scientific summary or report using vocabulary learned throughout the activities: archaeobotany, carbonization, data, feature, flotation, heavy fraction, light fraction, macrobotanical, soil sample
Activity One: Soil Flotation
This activity will simulate authentic archaeological flotation procedures in the classroom using common household materials like buckets and sieves and pantry items like dried seeds and nuts. These materials, including the plant remains once they are dry, can be reused year after year!
After setup, the active flotation part of the activity takes approximately 60 minutes for students to complete. Advance preparation involves charing seeds in an oven and mixing them with bins of topsoil to create “feature soil.”
Download the teacher and student guides below, researched and pilot tested by archaeologist and educator Elizabeth Reetz.
– Activity One: Preparation Guide for Teachers
– Activity One: Step-by-step Flotation Instructions for Students
Procedure
Pair off students and provide each pair with a bucket, sieve, and paper-lined drying tray. Assign each pair a feature number for their sample. If you prepared the supplies for a larger data set, have students repeat the process for each new soil sample.
Before beginning, students should record hypotheses in their activity packet. For example: List 3-5 types of plant foods you think might show up in the soil samples. What condition will they be in? “I think we will find plants like corn, tomatoes, and berries as seeds and corn cobs. The plants will be burned.”
Make sure students label their tray with their names, date, sample number, feature number, and areas for light and heavy fraction, which they must keep separate. Let the plant remains thoroughly dry on their trays (average drying time is 2-3 days) before proceeding to Activity Two.
After clean-up, have the students revisit their hypotheses and update their observations in their activity packet.
Group discussion questions: What makes this procedure challenging? What makes it innovative? Did your initial results align with your hypotheses?
Activity Two: Data Collection And Synthesis
Materials Per Class
– Comparative seed collections
– Microscopes or hand lenses (optional)
– Tweezers or picks for sorting
– Pages 2-3 of the Student Activity Packet (duplicate the data tracking sheet as needed)
– Pencils/Pens
– Whiteboard, chart paper, or digital spreadsheet template
Part 1: Plant Identification and Data Collection
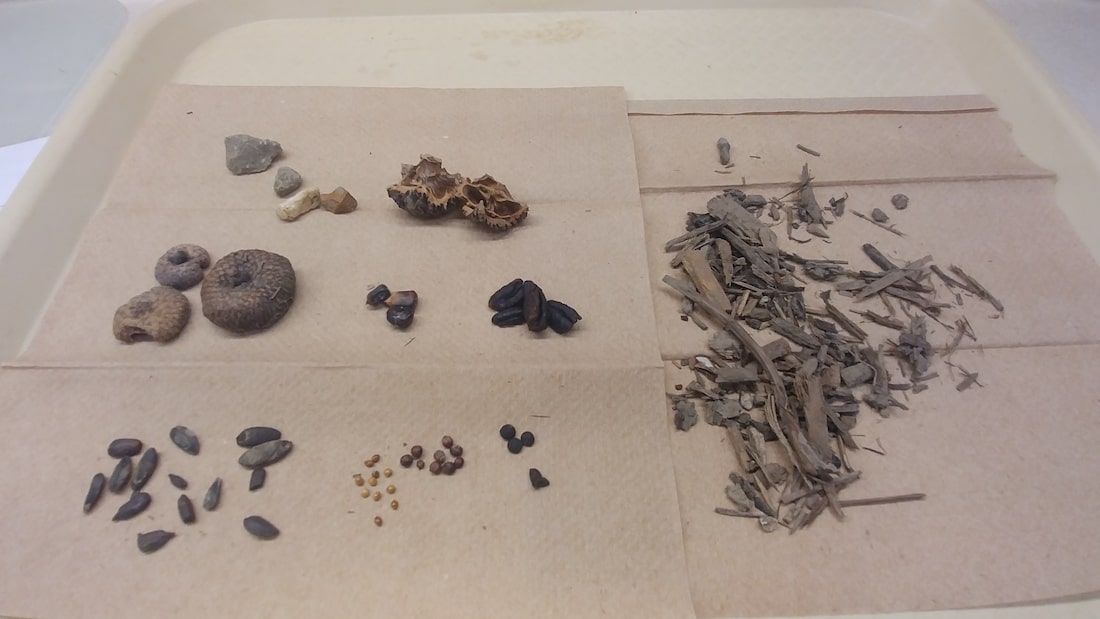
When the plant remains are sufficiently dry, the sorting and analyzing begins! Macrobotanical remains can be seen by the naked eye, but students may use microscopes or hand lenses to assist their identification. The comparative seed collections will assist this identification process.
With the same partners, students will “pick through” each light and heavy fraction sample to separate the plant remains. We are only focusing on food-related plant remains, so other inclusions such as wood particles and rocks can be discarded as “non-archaeological” waste debris.
Students should:
- Divide the plant remains in the light and heavy fractions by seed type.
- Identify the types of plants and count the number of each type.
- Fill out a data tracking sheet for each one-liter sample.
- Record their observations for each one-liter sample on page 3 of their activity packet.
Part 2: Classroom Synthesis and Data Analysis
After students complete their data tracking sheets and observation questions for each one-liter sample, work as a class to compile the data into summary tables using a whiteboard, chart paper, or this digital spreadsheet template.
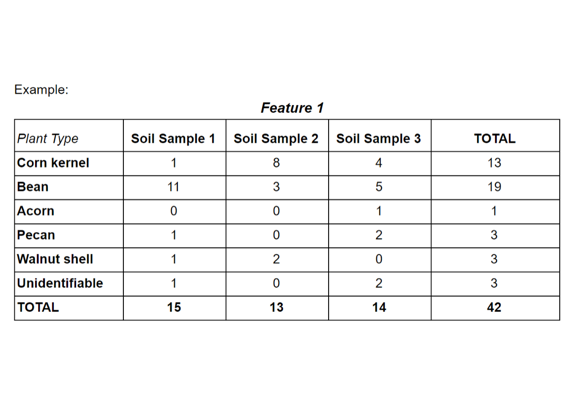
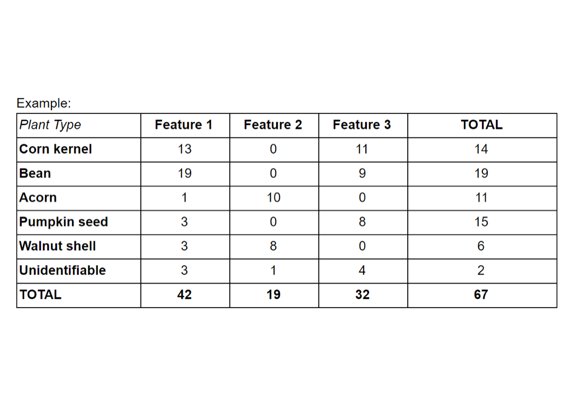
The whole class will participate in compiling this data, as each pair of students has data from different soil samples and features. Analyze this data to formulate and answer questions as a classroom discussion. The students should take notes on page 4 of their activity packet.
Classroom Discussion Questions:
- What was the dominant plant type in each feature?
- Which feature had the highest concentration of plant remains? Which had the greatest variety of plant types? What could this mean?
- What is the most frequently identified plant among all the features at this archaeological site?
- What other variability to do you notice?
- Based on your observations, can you make inferences on what activity each feature was originally used for? Remember, plant remains can be found in features like cooking fire pits, storage pits, trash pits, processing stations, and more.
- Think about the time of year or season each plant type could be harvested or gathered. Does the data provide insights to the season when each feature may have been used?
- Think back to the discussion on decomposition and carbonization. How do these processes impact our conclusions? What parts of plants and types of plants would we not expect to find based on these processes?
- What other questions do you have after looking at this data?
Part 3: Write an Archaeological Report!
Students will complete their observations on the Hypotheses and Observations worksheet. On page 5 of their activity packet, students will use vocabulary learned throughout the activities to construct an argument that explains human activity at your classroom archaeological site and provide data-driven evidence from their worksheets and classroom discussion to support this argument. This is an opportunity for students to practice technical writing like archaeologists by using their observations of the data to support inferences and build a narrative. Their interpretations do not have to be accurate, but they should convey that they understand the process of using the data to support their argument.
Review vocabulary from this lesson to assist them with their narratives:
– Archaeobotany
– Carbonization
– Data
– Feature
– Flotation
– Heavy Fraction
– Light Fraction
– Macrobotanical
– Soil Sample
Activity Three: Explore Real Archaeological Data
Materials: Activity Three: Regional Archaeological Archaeobotany Data
Now that you have a class of archaeobotany experts, let’s explore some authentic archaeological data! Archaeologists across the country provided data for students to explore. The data are excerpted from summary tables in real archaeology reports and state databases.
Teachers: Choose one or more regional datasets (download this regional archaeological archaeobotany spreadsheet) to review and compare with your classroom data.
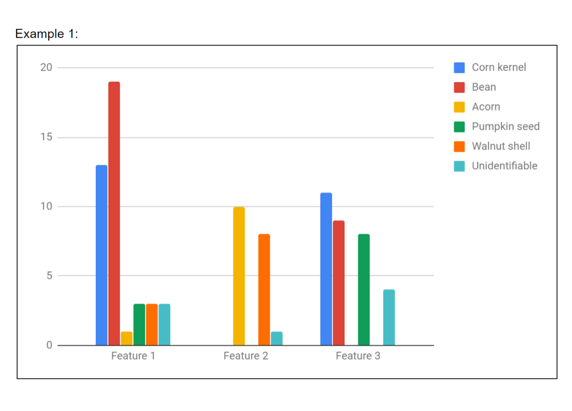
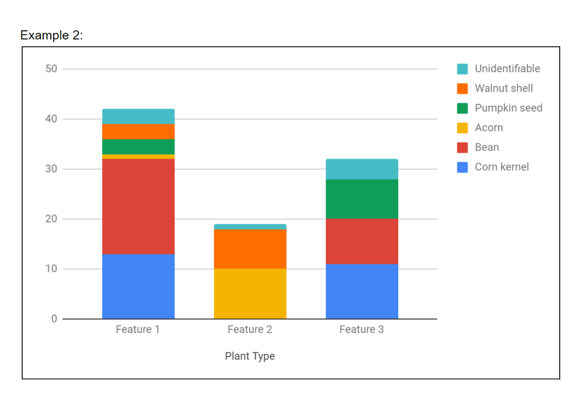
Optional: Make column charts or bar graphs of the archaeological data for a visual comparison.
Questions For Discussion:
- The archaeological data comes from what time period? How do you know?
- What types and varieties of plants were identified in the archaeological record? How does this compare with your classroom data?
- Are the plants from the archaeological record domestic (grown in a garden), wild (foraged or gathered), or both? What does this tell us?
- Are there any plants that are unfamiliar to you? How do you think they were processed and eaten?
- What plants are still commonly eaten today? Where do these plants come from and in what form do we eat them?
Summarizing The Experience
In these activities, students performed an authentic laboratory technique used by archaeologists to recover ancient plant remains, identified plant remains in their soil samples, documented frequencies of each plant type, and created tables and graphs to analyze the data and make inferences about archaeological feature function and human diet.
- The goal of archaeology is to learn about how people lived in the past. How do archaeologists use data and evidence to interpret the past?
- What does this data tell us about the lives of the people at these archaeological sites?
- If archaeologists could not recover plant remains from archaeological sites, what information about the lives of past peoples would we be missing?
- Archaeological evidence usually raises more questions for research. What else do you want to know? How would you find out?
- Which parts of this activity were most interesting to you? Do you think you would enjoy doing archeological work?
Extensions
– Expand on the Activity Two reports by comparing and contrasting classroom data with the regional archaeological archaeobotany data. Encourage multiple evidence-based narratives! There is more than one story to be derived from archaeological data.
– Research foods common to ancient diets. Some of the foods listed in the regional archaeological data tables are not commonly eaten today. What are they? Do they still grow, and if so, where?
– For older grades: Explore the comprehensive Arizona Data Table in the Regional Archaeological Archaeobotany Data spreadsheet. This data is from a single site in Tucson, Arizona, and it documents over 4,000 years of human plant use! What are the similarities and differences among the time periods? Which plants are edible and which are not? Data was provided by Mike Diehl of Desert Archaeology, Inc.
CSS And NGSS Standards
CCSS.ELA-LITERACY. RST.6-8.3; CCSS.ELA LITERACY.RST.9-10.3; Follow precisely a multistep procedure when carrying out experiments, taking measurements, or performing technical tasks.
MS-LS2-4. Construct an argument supported by empirical evidence that changes to physical or biological components of an ecosystem affect populations. Connections to Nature of Science; Scientific Knowledge is Based on Empirical Evidence; Science disciplines share common rules of obtaining and evaluating empirical evidence. (MS-LS2-4)
HS-LS2-2. Use mathematical representations to support and revise explanations based on evidence about factors affecting biodiversity and populations in ecosystems of different scales.
Thanks To:
John Marston of the Boston University Environmental Archaeology Lab
Michael W. Diehl of Desert Archaeology
Leah Stricker of Jamestown Rediscovery, Historic Jamestown
Jess Robinson of the Vermont Division for Historic Preservation
Michael C. Moore of the Tennessee Division of Archaeology
Gina Powell of the U.S. Army Corps of Engineers, Kansas City District
Bill Green of the University of Iowa Office of the State Archaeologist
Credits:
Written by Elizabeth Reetz
Edited by Brian Soash, Ariel Zych, Shirley Campbell, and Johanna Mayer
Photographs by Elizabeth Reetz
Animation by Jonathan Frier
Digital production by Johanna Mayer
Educator's Toolbox
Meet the Writer
About Elizabeth Reetz
@ecreetzAs Director of Strategic Initiatives for the University of Iowa Office of the State Archaeologist, Elizabeth Reetz casts a wide net to effectively communicate science and culture through public engagement. She does this by creating interpretive media and curricula, presenting to classrooms and communities, and researching outreach best practices. She is a member of the 2019 Science Friday Educator Collaborative.