Educational Resource
Read More
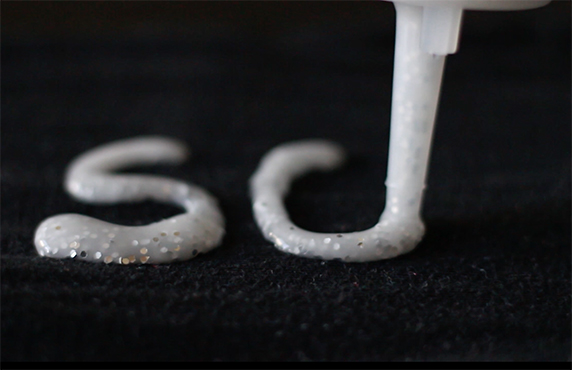
Make 3D Paint With Starch
Experiment with solubility as you create homemade 3D paint with starch.
Educational Resource
Read More
Build An Ultra High-Speed Toy Out Of Paper
Make a paper toy that spins thousands of times per minute, and then measure, and try to modify, its speed.
Educational Resource
Read More
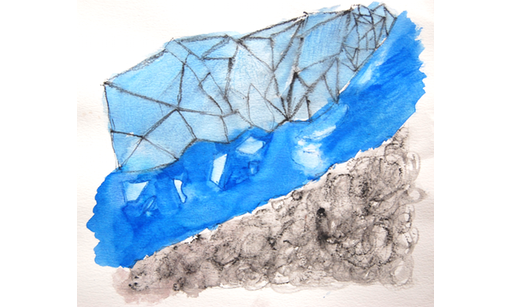
Illustrated Graphs: Using Art to Enliven Scientific Data
Create an illustrated graph using real scientific data, and write an artist’s statement to explain your thinking. Try it with climate change!

Educational Resource
Read More
See The World Through Color-Filtering Lenses
Explore color by creating color-filtering glasses using paper and tinted cellophane.

Educational Resource
Read More
Discover DNA By Making Colorful Chromosomes
Discover how human physical traits are determined by specific segments of genes, then build a simplified model of a pair of chromosomes.