Educational Resource
Read More
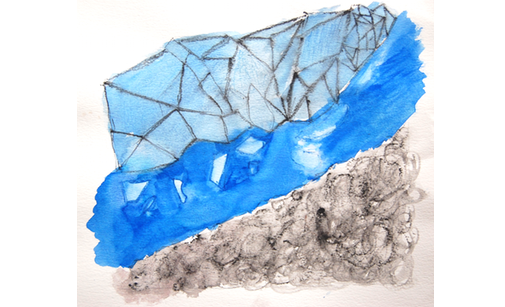
Illustrated Graphs: Using Art to Enliven Scientific Data
Create an illustrated graph using real scientific data, and write an artist’s statement to explain your thinking. Try it with climate change!
Educational Resource
Read More
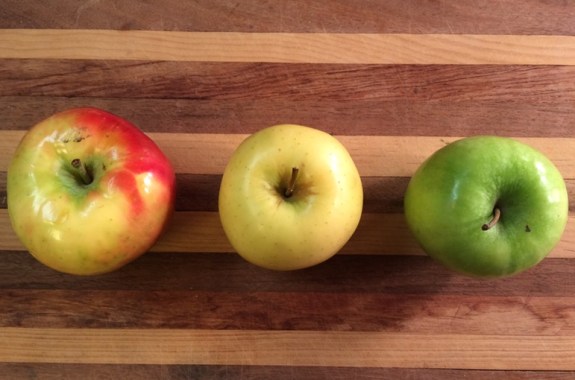
The Tragic Mystery Of The Mushy Apple
In this experiment, you’ll explore the influence of apple cell structure on the crunchiness and juiciness of an apple by measuring apple tissue tensile strength.

Educational Resource
Read More
How Dense Is Snow?
How much water is there in snow? Use a kitchen measuring cup—and your math skills—to calculate the density of snow!
Educational Resource
Read More
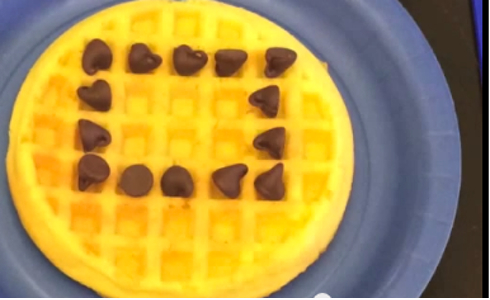
No Waffling On The Numbers
Three delicious math games you can play on your waffles to build math fact fluency and geometry skills, from the folks at Bedtime Math.
Educational Resource
Read More
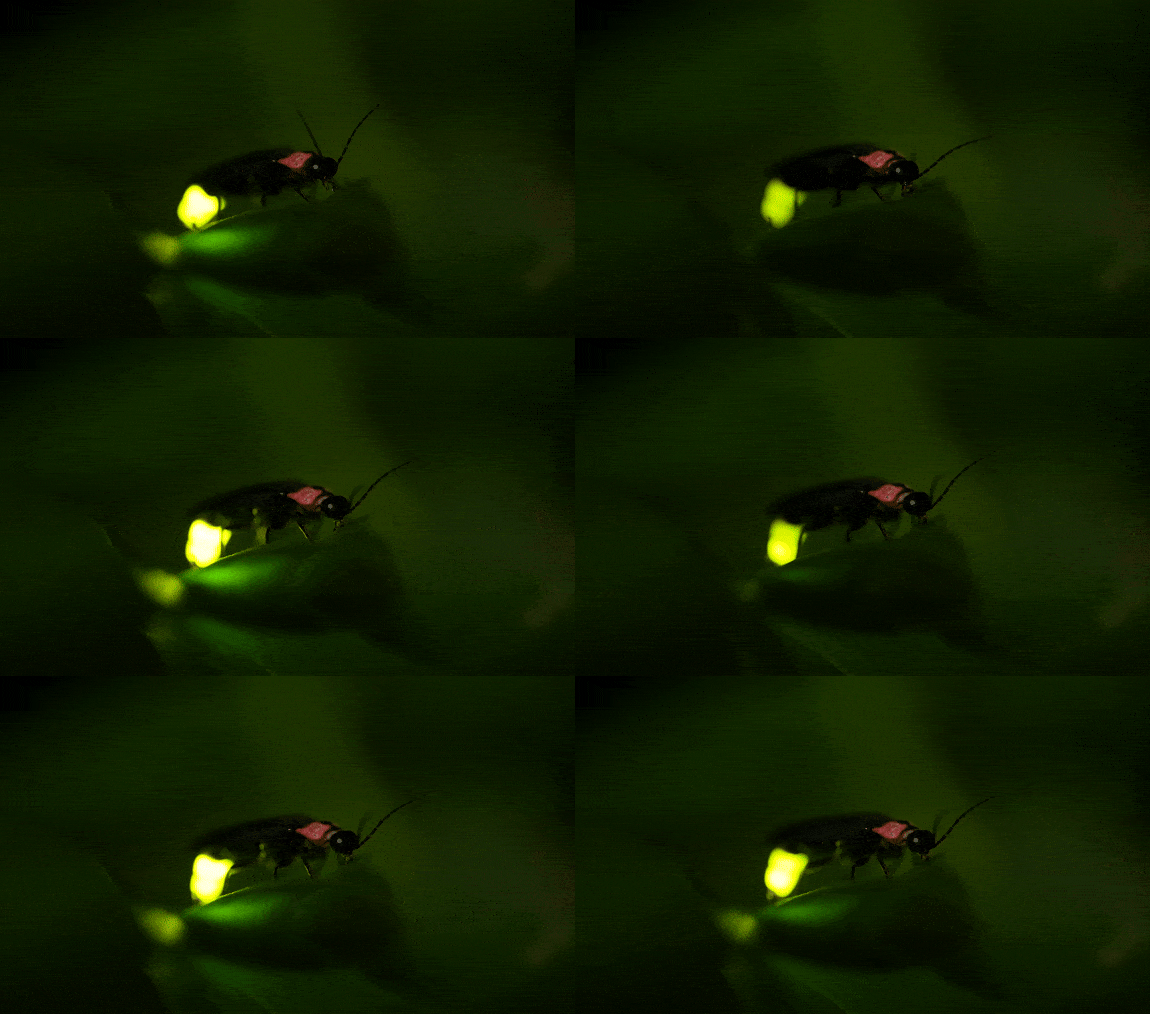
Illuminating Luminescence
Compare and contrast different forms of luminescence by observing how chemiluminescence, phosphorescence, and fluorescence produce or emit light.