Grade Level
6 - 8
minutes
15 min - 1 hr
subject
Earth Science
Activity Type:
ecosystem interactions, earth science, graphing, data visualizations
Polar bears are difficult to track and observe in the wild. They live solitary lives, wander thousands of miles every year, and give birth to cubs in snow-covered dens. The barren Arctic landscape where they live is also constantly changing.
If polar bears are so difficult to observe, then how do scientists study them in the field?
In this activity, you will explore how scientists track and measure individual polar bears in order to better understand the health of the overall population.
Your goal is to learn how changes in the Arctic ecosystem—particularly sea ice loss—are affecting the species.
In the process, you will see what it’s like to tranquilize and measure a polar bear in the field and try your hand at interpreting health data collected from real polar bears.
How Do You Measure Something You Can’t Directly Observe?
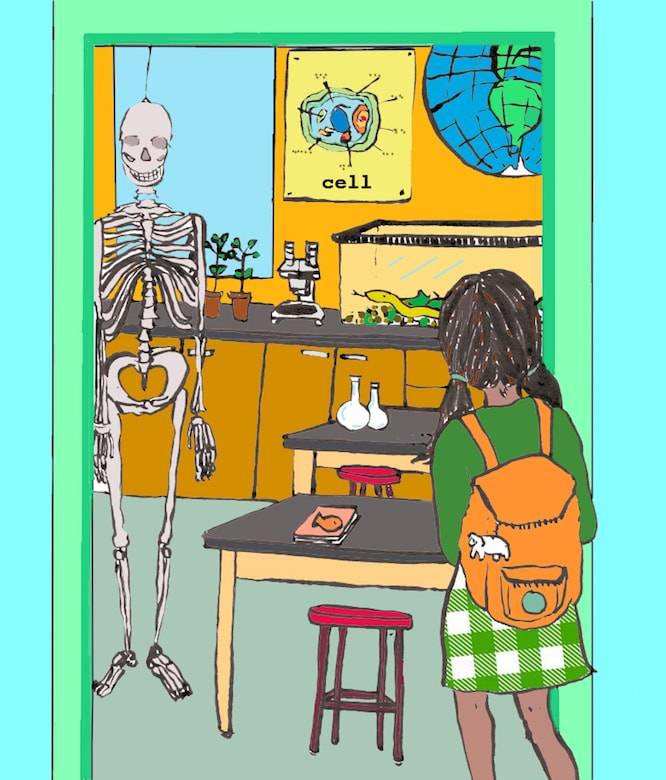
Imagine that you have just started at a new school, and you don’t know which classroom to go to for your first-period biology class. You arrive early, none of the classroom doors are marked, and there’s no one around to ask, so you start walking into different classrooms. How would you figure out which classroom is the right one?
Do you look for science-related posters on the wall? Is there lab equipment, such as microscopes or scales? Objects like scientific signs and labware would serve as clues that you had found the biology classroom, even if they didn’t tell you directly that you were in the right place.
 Scientists call clues like these indirect evidence, or proxy data. Proxies give researchers insight into subjects that are difficult to study directly.
For example, a scientist researching the rainfall history of a region over hundreds of years can’t go back in time and measure daily amounts of rain. Instead, she might look at the thickness of tree rings as a proxy for past rainfall. Thick growth rings indicate that more water was available for a growing tree, while thinner rings indicate water scarcity.
Polar bear researchers also depend on proxy data. To determine how old a polar bear is, for example, scientists will measure the size of the bear’s teeth. Or, to figure out what kind of food a bear is eating, scientists can measure the amount of fatty acid in its blood.
Scientists often rely on both direct and indirect evidence to draw conclusions about a subject. Can you think of a direct measurement that a polar bear researcher might make?
Breakthrough: Polar Bear Witness
Polar Bears And Sea Ice: What’s The Connection?
Polar bears are dependent on sea ice to hunt prey—their diet consisting primarily of ringed seals and bearded seals. A decline in sea ice is a major threat to polar bears, which are currently listed as “vulnerable” on the Endangered Species List.
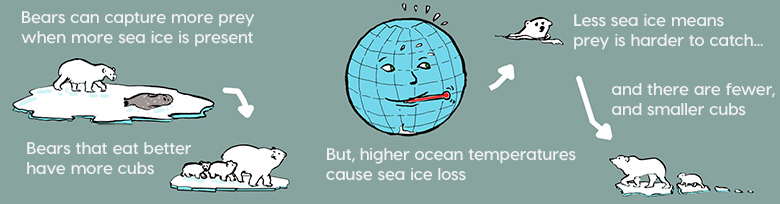
The diagram above illustrates a relationship between declining sea ice and rising ocean temperatures. When sea ice melts, it exposes more ocean to sunlight. Ocean water is a darker color than sea ice, and it absorbs solar radiation just like a dark T-shirt on a hot summer day. The water consequently warms, causing more sea ice to melt. This cycle can continue in what’s called a positive feedback loop. Positive feedback loops tend to amplify any change that is happening in a natural system.
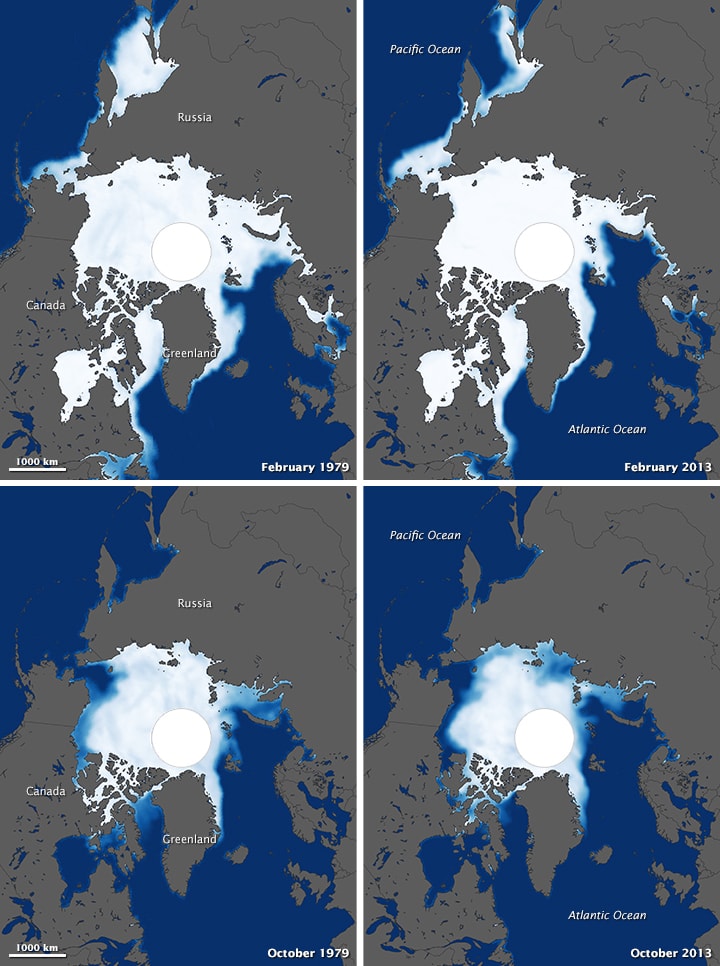
This series of images from the NASA Earth Observatory shows Arctic sea ice coverage from the late 1970s until 2013. Where do you see the biggest losses?
You can see real-time updates on Arctic sea ice coverage, as well as historic levels, by exploring this interactive from the National Snow and Ice Data Center.
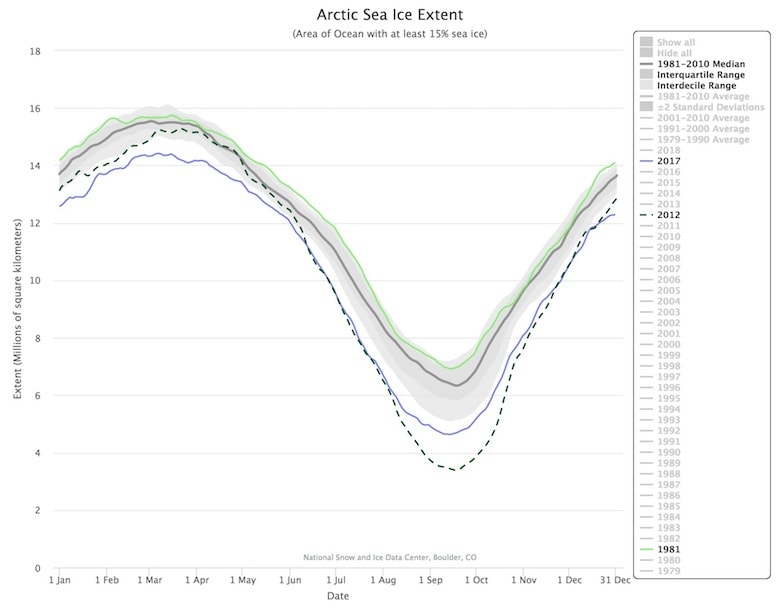
Using Charctic, click on a year in the right-hand column, and hover over the chart to see how sea ice extent changed during different months of that year. Then answer the following questions:
- What is the extent of sea ice this week?
- How does the current extent of sea ice compare to the average from 1981–2010?
- What was the maximum amount of ice coverage this year? The minimum?
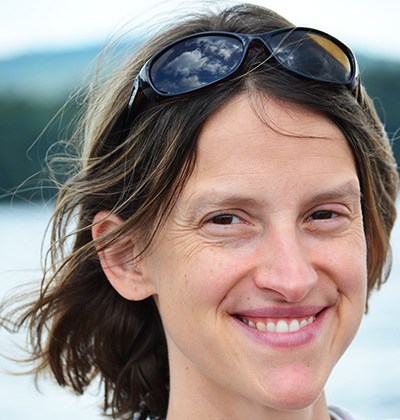
Meet The Polar Bear Biologist: Karyn Rode
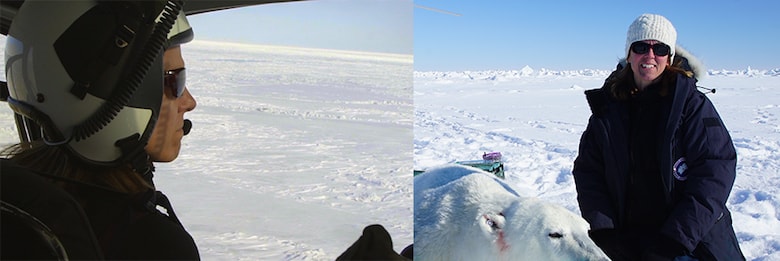
Karyn Rode, a wildlife biologist with the United States Geological Survey, conducts research on polar bears in the Arctic. Each year, she tracks, tranquilizes, measures, samples, and occasionally tags more than 50 polar bears in order to gather direct and indirect data on polar bear health and behavior.
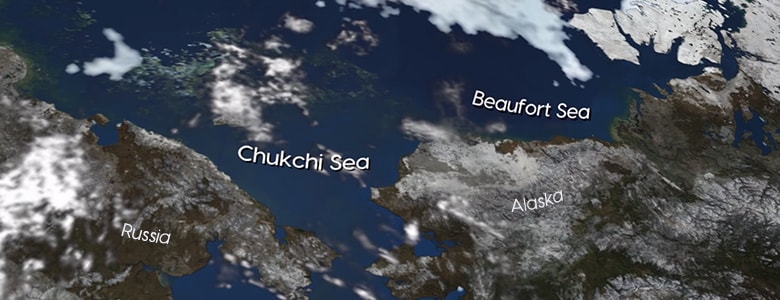
Rode is particularly interested in two populations of polar bears: one in the Chukchi Sea and another in the Beaufort Sea. In both regions, sea ice has been decreasing.
Watch this short documentary about Rode’s Chukchi Sea polar bear research.
While you are watching the video, read the transcript and underline or highlight any methods that Rode uses for collecting data.
After watching the video, answer the questions below. You can record your responses on this Polar Bear Witness Response Sheet (word version).
- Briefly, what is the procedure that Rode and her colleagues follow to collect data from wild polar bears?
- Look back at where you highlighted examples of data collection. Which examples involve direct evidence? Which examples involve proxy data, and what questions do these proxies address?
- What are some of the questions that Rode hopes to answer?
- Do any of those questions address sea ice extent, and if so, how?
- What do you find interesting about how Rode and her team collected data?
- Could you see yourself traveling to these extremes to observe polar bears? Do you think you could do it for weeks or months at a time?
When there is a decline in sea ice, it’s harder for polar bears to hunt for prey. If females don’t get enough food to eat, they may not grow as large. These smaller females tend to give birth to smaller cubs, which have a lower chance of surviving.
Rode’s research examines how distinct polar bear populations respond to fluctuations in sea ice extent. Data like hers is crucial to better understanding how organisms in the Arctic ecosystem are adapting to changes in the environment.
This kind of research can help inform governmental policy decisions—at local and international levels—on how to manage the wildlife and where to build and develop land. (Learn more about polar bears and policy later on in this resource).
Private: Use Flubber to Model Ice Shelf-Glacier Interactions and Sea Level Rise
Be The Polar Bear Biologist
Explore this 360-degree, virtual sample site to get a sense of what it feels like to track, tranquilize, and measure a bear in the Arctic.
Now that you have learned about how Rode gathers data in the field, it is your turn to virtually collect samples from polar bears. You will determine how the body masses of polar bears in the Chukchi and Beaufort regions compare over time. You will be looking at a small subset of data from bears that were collected in those two regions during two different time periods: 1986–1993 and 2008–2013 (from Rode et al 2014).
In order to determine if changes in sea ice are associated with changes in bear size, it is important to limit, or control, any factors that might influence bear size that are not related to sea ice changes. For instance, because male bears over the age of one are larger than females (often up to twice the size!), your data set includes only males older than a year. In addition, the data was collected in the spring, when bears are most dependent on sea ice for hunting. (During the summer when sea ice extent is lower, the bears must travel farther to find food, and their weight can fluctuate widely).
Print the polar bear data cards to get started.
You can also download a spreadsheet of the polar bear data.
What To Do:
Divide into small groups and obtain enough bear cards so that each person has at least a couple. Each card lists the age and weight of a real bear that was measured by Rode’s team, as well as the region and time of sample collection. After examining the cards, group members should create a polar bear data table using the data in the cards.
Once the data table is complete, group members should plot their data on this shared polar bear growth chart. Use four different colors: one color for bears sampled in the Chukchi Sea region during 1986–1993; a second color for bears in the Chukchi Sea region from 2008–2013; a third color for bears in the Beaufort Sea region during 1986–1993; and a fourth color for bears in the Beaufort Sea region during 2008–2013. (Tip: Use warm colors—e.g., red, orange—for the Chukchi Sea data and cool colors—e.g., blue, purple—for the Beaufort Sea data.)
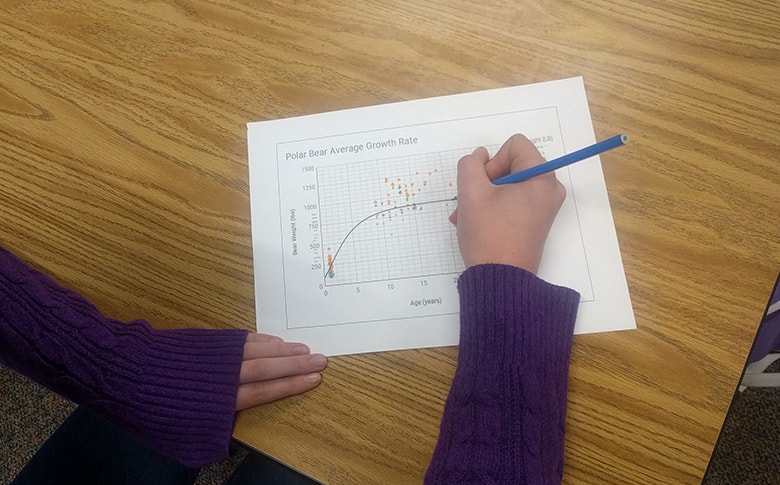
Once each group has graphed its data set, all groups should come together to compile their data onto two big scatterplots, one for the Chukchi Sea and one for the Beaufort sea, using the chart provided. Notice that the chart already has a line. This line, called a growth curve, was generated from data collected by Rode’s team from 1982–2006 (Rode et al 2014). It reflects the average body mass of a male bear for each age sampled.
Educators: For whole-group charting, start by projecting the chart onto a whiteboard or piece of chart paper, then use whiteboard markers or large colored dot stickers to plot data as a group.
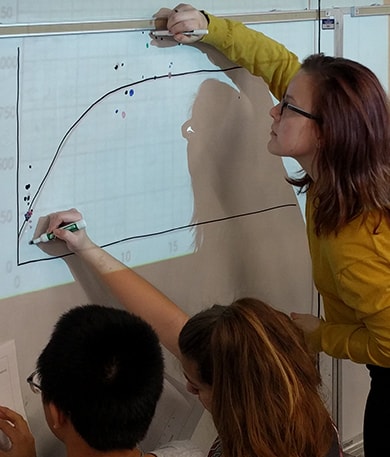
As you plot your data, notice where the points fall with respect to the growth curve. If a data point falls below the curve line, the bear is considered smaller than average. If a point is above the growth curve line, then the bear is larger than average.
Once the scatterplot is completed, answer the following:
- Are there obvious differences in size between the two geographic groups of polar bears?
- Are there obvious differences in size between the two time periods for each geographic group?
- Do polar bears in one region appear to change more between the two time periods than bears in the other region? If so, which geographic group? How can you tell?
- Fill out a Venn diagram with your conclusions about the similarities and differences between the two regions:
Now that you’ve seen the data, listen to this interview excerpt featuring Rode and Science Friday video producer Luke Groskin, who filmed the documentary, as they discuss a recent trip to the Chukchi Sea, off the west coast of Alaska.
Audio excerpt of “The Polar Bear Necessities” June 30, 2017. Print this audio transcript (word document)
In addition to data on body mass, Rode and her colleagues also collected key pieces of data on bear length and the size of their skulls. They also looked at how much time the bears were spending on land versus ice.
They found that in the Beaufort region, there was a decline in the body mass of polar bears that was associated with diminishing sea ice and a lack of food.
In the Chukchi region, where bears also face declining sea ice and limited food, there was not as noticeable a difference in body size.
What might account for the difference between how bears in each region changed physically? Look for clues in your notes from the documentary on Rode’s research.
Imagine that you are a scientist working in the Arctic and just analyzed this data, and you now have to plan the next field season:
- What would you want to find out next?
- Is there a new region that you would want to visit?
- What else would you want to study about polar bears in the Arctic?
- How would you communicate the importance of furthering your research to public officials, research universities, and funders?
How Do Infections Spread In Plants?
Go Deeper
Observe Polar Bears
Watch some polar bears in action! There are several zoos in North America that maintain live webcams on their polar bears. Follow the links below to watch them, and to learn more about what different conservancy groups are doing to protect the species, and what you can do to help.
What are the bears doing right now? How do you think they spend their time? How do the lives of these polar bears differ from the ones that we have been studying in the wild? What do you think these bears eat? Do you have any predictions on how the size and health of the polar bears at the zoo differ from that of their wild counterparts?
If the polar bears are camera-shy, try looking at posted highlight reels.
Explore Original Research
Interested in some of the original research behind this resource? Check out this article to read the original data analysis.
Think About Polar Bears And Policy
Oil and gas development is a burgeoning industry in the Arctic for both American and Russian companies. Drilling can disrupt polar bear populations by fragmenting their territory and making it more difficult for them to hunt and to build dens for their cubs.
In addition, native groups in Alaska and Russia hunt polar bears annually for food. The U.S. and Russia must coordinate hunting allocations to ensure that polar bear populations are not overly depleted.
How can our understanding of polar bear populations in the Chukchi and Beaufort seas affect how and where we allow drilling and mineral exploration? How might polar bear research help countries decide on the number of bears that can be sustainably hunted in a given year?
References:
Rode, Karyn D., et al. “Variation in the response of an Arctic top predator experiencing habitat loss: feeding and reproductive ecology of two polar bear populations.” Global Change Biology 20.1 (2014): 76-88.
Credits And Notes From The Field
Teachers who field tested this resource had the following advice for teachers adopting this resource:
April from Florida said: My favorite part was the video about the research. I had several students who never even knew scientists did things like this and now want to potentially peruse this as a career.
Turtle from New Mexico said: My favorite part was graphing the per sea bear data. Students seemed to have an “AH” moment when they compared the data from both seas.
Resource writing: Katharine Hinkle
Illustrations by Karen Romano Young
Editing: Julie Leibach, Ariel Zych, Lauren J. Young
Digital Production: Lauren J. Young
If you have questions about this resource or would like to share your experience using it with students, please e-mail us at educate@sciencefriday.com or tweet to @scifri
Educator's Toolbox
Meet the Writer
About Katharine Hinkle
@KatharineHinkleAs a high school earth science teacher at Innovation Academy Charter School in Massachusetts, Katharine Hinkle’s unflagging goal is to get her students excited about venturing outside and observing their environment. She wants her classes to understand how familiar landscapes form and how scientific issues play out in their local communities.