Grade Level
9-12
minutes
2 hours
subject
Earth Science
stem practices
Developing and Using Models
Activity Type:
model, data collection, Groundwater, aquifer, pollution, mining pollution
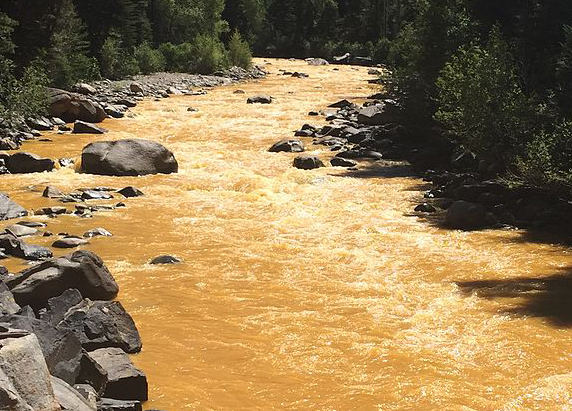
In 2015, the Gold King Mine, a historic mine that was a toxic waste site, was being excavated by the EPA to begin the long process of cleaning up acid waste that had collected within the historic mine. Then the unthinkable happened: A major spill occurred, unloading millions of gallons of metal-contaminated acid mine drainage into a nearby river in a pollution event that would ultimately affect three states, and multiple Indigenous tribes in the region.
Hydrologist Karletta Chief stepped in, insisting on more careful analysis of water and sediment to ensure that the water was eventually going to be safe for the hundreds of ways that members of the Navajo Nation, her own Indigenous community, use the water.
Watch this video to learn about the Gold King Mine spill, and the efforts of one scientist to understand and mitigate its impact on the region.
Why do events like the Gold King Mine spill influence so many individuals, in so many ways? How does water travel above and below ground, and how can we use that information to predict who is affected by surface and groundwater contamination? To find out, you’ll create a model of a shared natural underground water supply—a shared aquifer—and experiment with how simulated contaminants move through the aquifer by conducting your own water testing.
Educators, fear not: We’ve got DIY Groundwater Model Instructions that with a little elbow grease and $60 in parts will make 10 working groundwater models (for groups of three students) that you can use year after year!
Students will:
- Model how a shared aquifer is affected by precipitation and acid mine drainage
- Participants will monitor the acidity of water over time to ensure their simulated water supply meets National Secondary Drinking Water Regulations (NSDWRs) of 6.5-8.5 pH
- Participants will use their data to map contaminant plume movement over time
- Extension: Create and test a remediation solution
An Introduction To Groundwater
After a heavy rain, you’ll likely see some standing water and a few puddles that collect on the surface of the ground. You might even see water flowing along roads and sidewalks into storm drains. But what you probably don’t see is the incredible amount of water that is absorbed directly into the ground.
In most places that aren’t covered by rock or asphalt, there are spaces between bits of rock and particles of clay and soil that provide pathways for water to travel after it rains. Thanks to all of these small spaces, the ground can absorb a lot of water. Beneath the ground we walk on, sometimes miles below the surface, large amounts of water can collect as groundwater. Wells, springs, and pumps make it possible for us to extract groundwater for many uses, including drinking and household use, agriculture, and manufacturing.
Groundwater doesn’t always stay in one place, it can diffuse, drift, and flow from place to place underground. Similarly, when pollution spills onto the ground or leaks from a common source of pollution (called a point source) into lakes, streams, the groundwater that gets contaminated can move the pollution from place to place.
In order to understand how water, and water pollution, move through groundwater, it helps to master a little vocabulary:
Aquifer
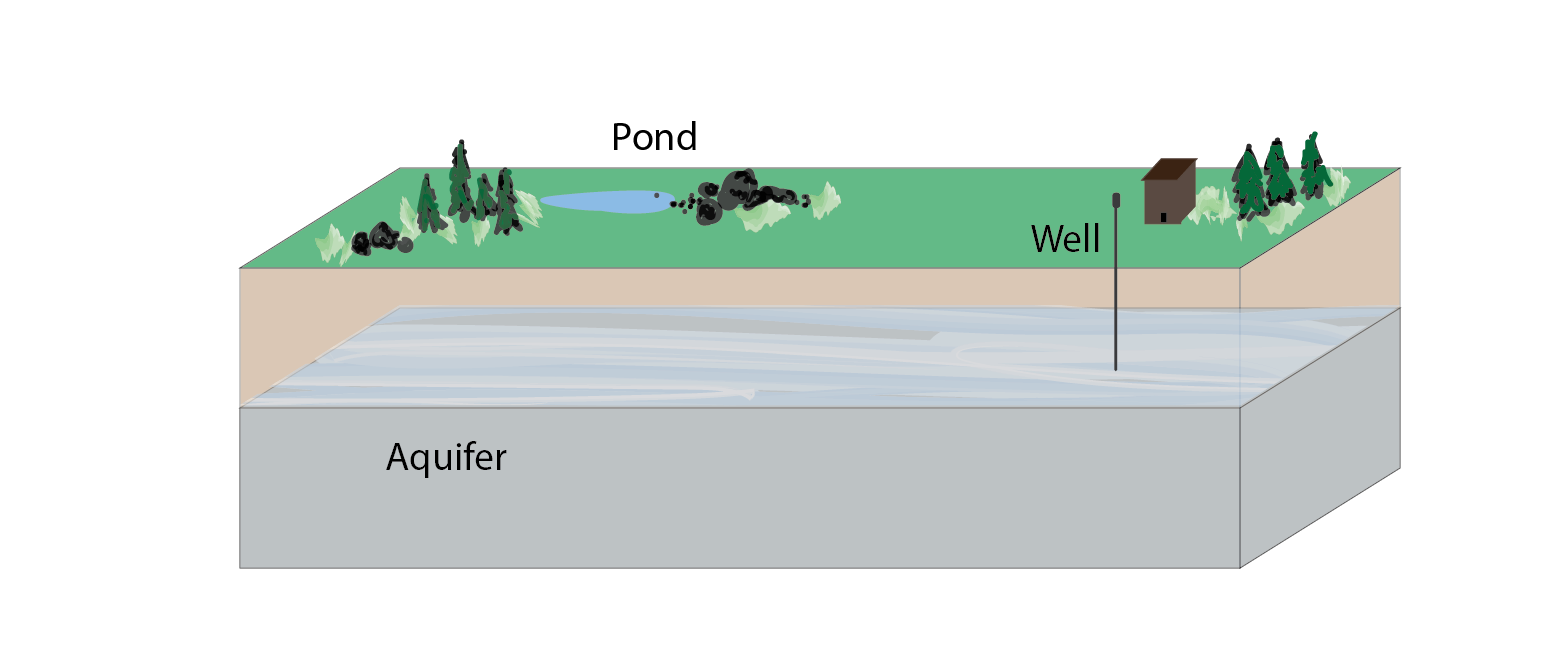
An underground body of permeable rocks or sediments that is saturated with groundwater, which can be brought to the surface by a well or spring. Water can move from place to place within an aquifer. Aquifers can be very large, spanning many, many miles and providing drinking and irrigation water for multiple states.
Recharge
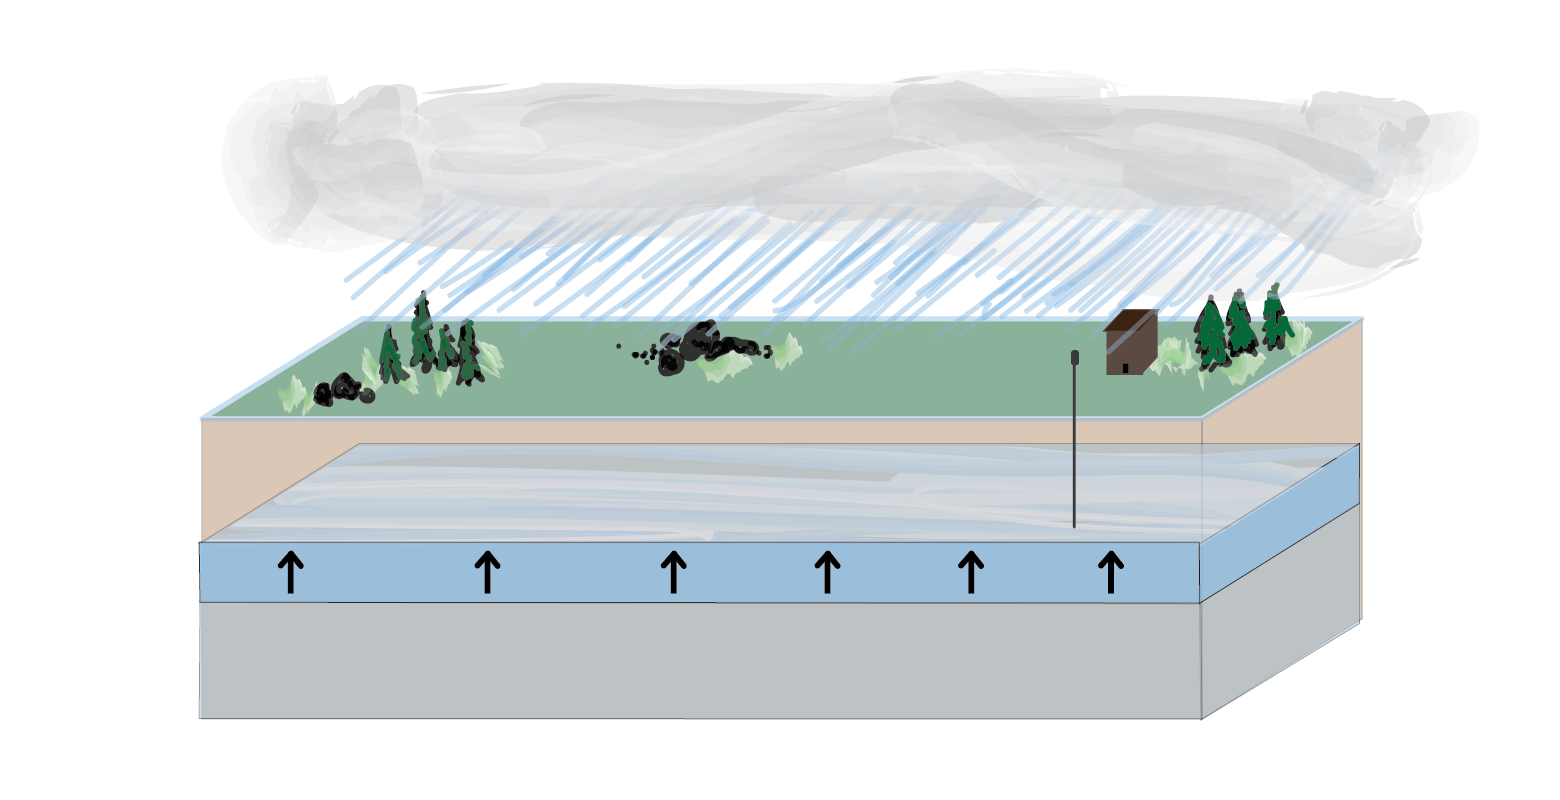
When it rains and water permeates into the soil, water can be added back into an aquifer. This is called recharge. In places where it is periodically dry and where aquifers are depleted by human activities, recharge can be essential for ensuring that water remains available for irrigation and drinking.
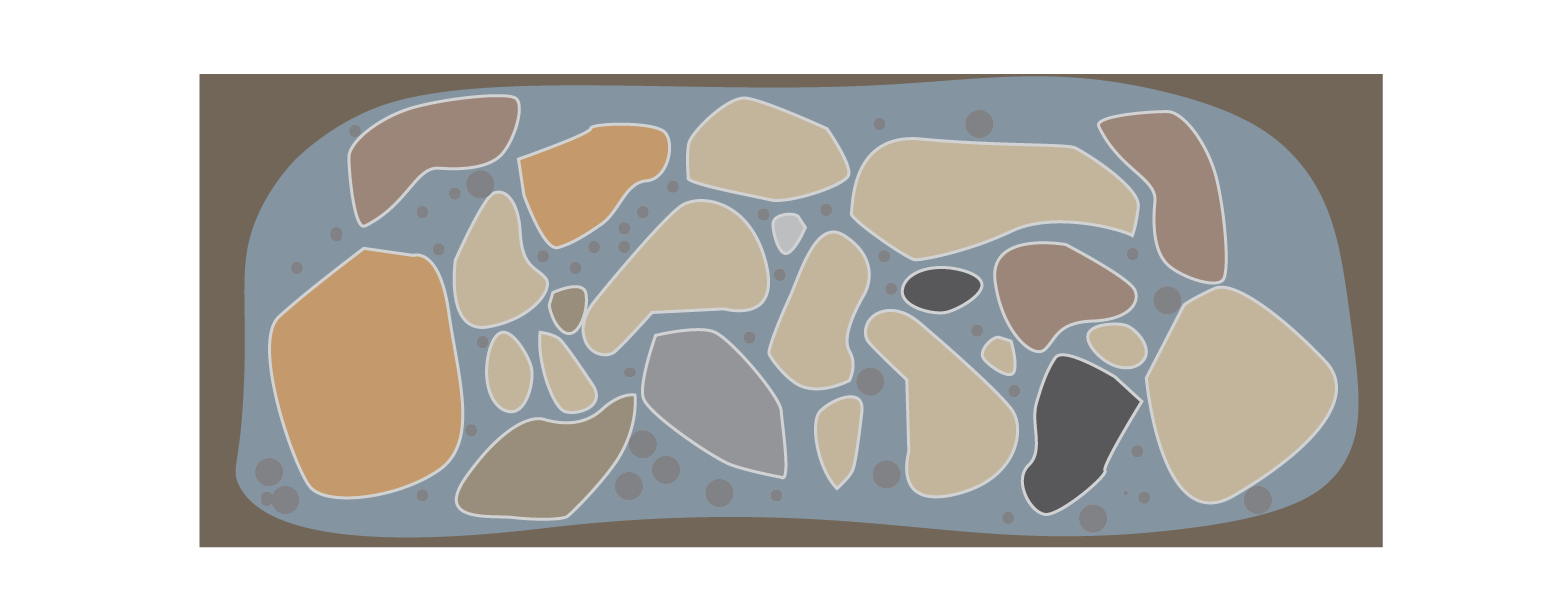
Porosity
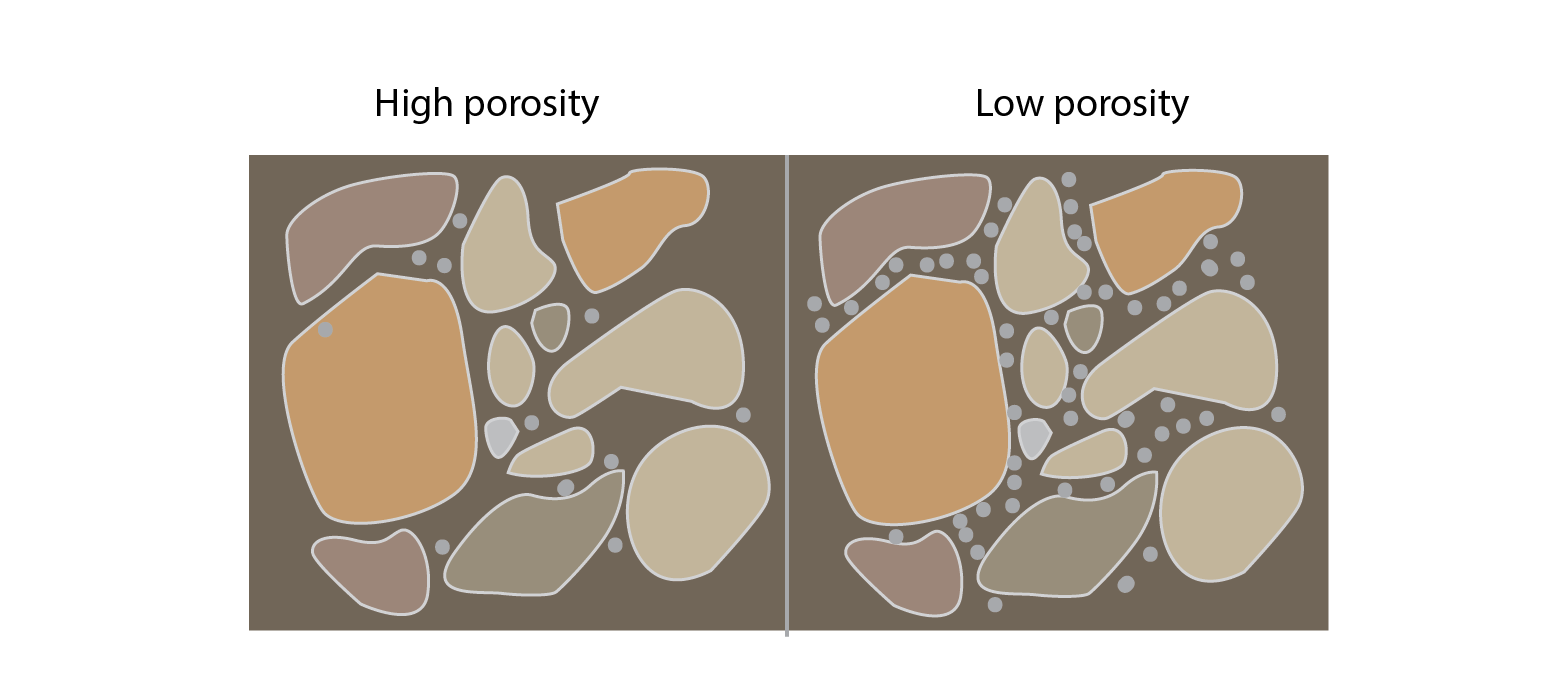
The percentage of open space (pore space) in a rock or sediment sample. Sediments like sand, silt, and clay usually are very porous and can store lots of groundwater in the pore spaces. Many igneous and metamorphic rocks have very low porosity unless they are fractured.
Permeability
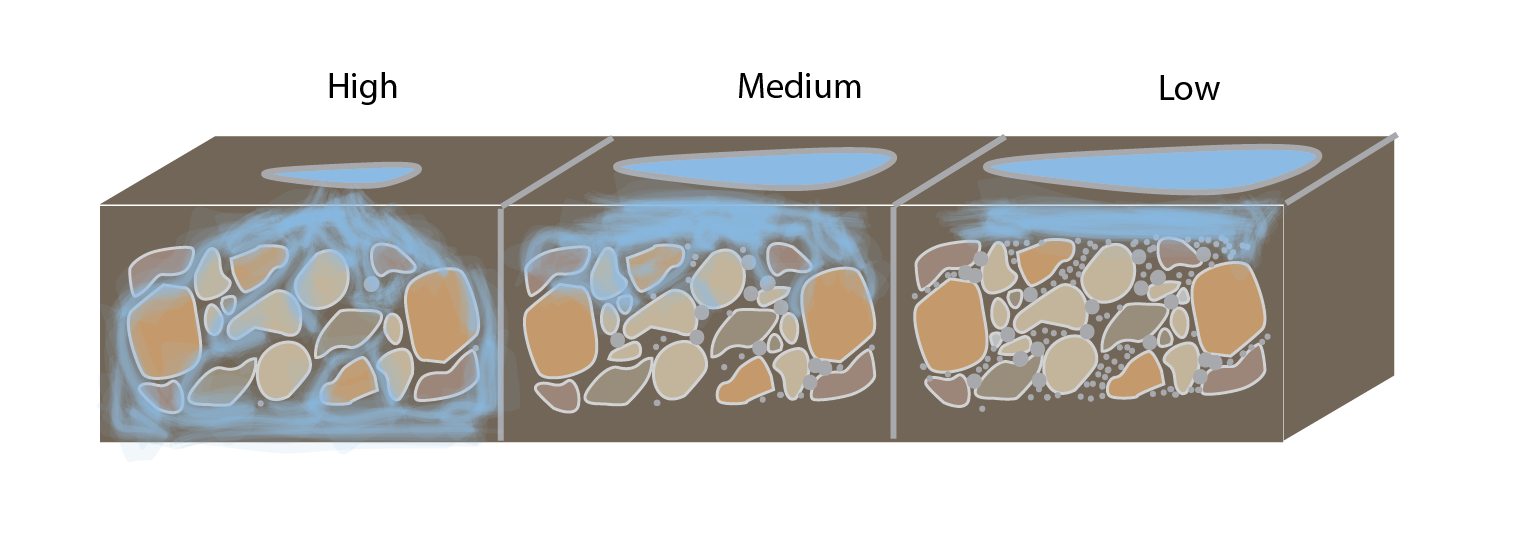
The rate at which water can flow through porous rocks or sediments. Permeable rocks and sediment allow well pumps to withdraw much greater volumes of water per hour than less permeable rocks or sediments and are recharged more quickly by rainfall.
Pollution Plume
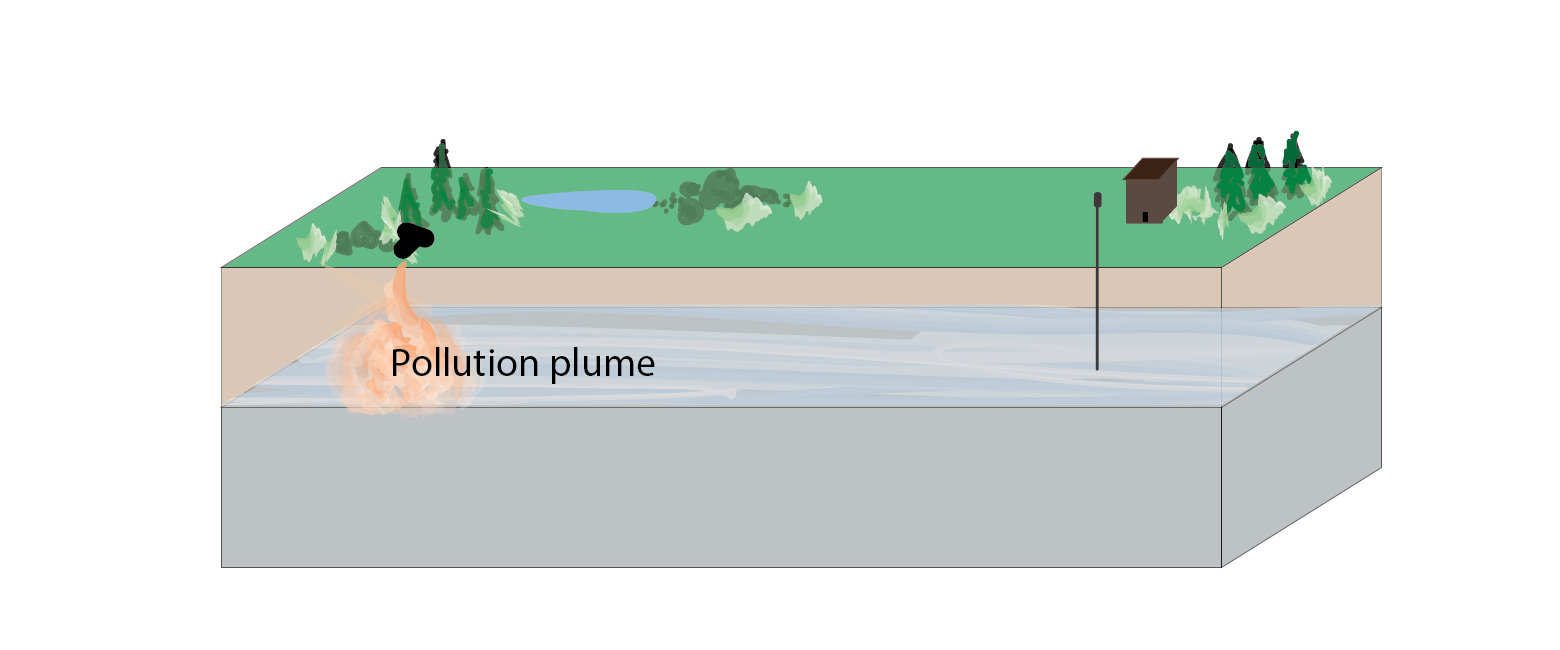
A body of polluted groundwater. A pollution plume may flow and diffuse within an aquifer, affecting different areas over time.
Groundwater Checks For Understanding—With Graphics!
Answer each of the following questions, annotating and incorporating diagrams in your answers. Print out this worksheet version which includes diagrams to help you (docx version).
- Why would pollution contamination of an aquifer be potentially more serious (put more people at risk) than contamination of a small surface pond?
- How do you think porosity affects the amount of surface water that will be absorbed and stored as groundwater following a rain storm? Why?
- How would a recharge event, such as a series of rainstorms, affect the direction that a pollution spill at the surface might travel if the soil had high permeability? What if the soil had low permeability?
- If there is a pollution plume on one side of an aquifer, and someone pumps water from the opposite side of the aquifer, do you think the pollution plume will move towards the pump, away from it, or stay in the same place? Why?
- Explain how the porosity of soil might affect its permeability. If it helps, you can annotate the diagram below as a part of your explanation.
Groundwater And Coal Mines: Acid Mine Drainage
When underground water and air come into contact with the sulfur- and iron-containing rocks (for example pyrite) commonly found in coal mining operations, a chemical reaction can occur which forms sulfuric acid and iron dissolved in water. Through this process, old mining sites can become reservoirs of highly acidic, iron-rich groundwater that can leak out of the mine slowly (or in the case of the Gold King Mine be released and flush out quickly) and contaminate nearby aquifers, lakes, and streams. This pollution, called acid mine drainage, can turn lakes and streams yellow or orange, as occurred during the Gold King Mine spill described by Karletta Chief in the Science Friday video above.
Though water acidity is hazardous for plants and wildlife in its own right, it poses particular risk to humans because of its ability to dissolve heavy metals. As contaminated acid mine drainage comes into contact with rocks and minerals that naturally contain heavy metals such as lead, copper, arsenic, and mercury, those metals dissolve and are added to the water, resulting in highly toxic pollution that can contaminate drinking water and harm plants and wildlife.

Build A Groundwater Model
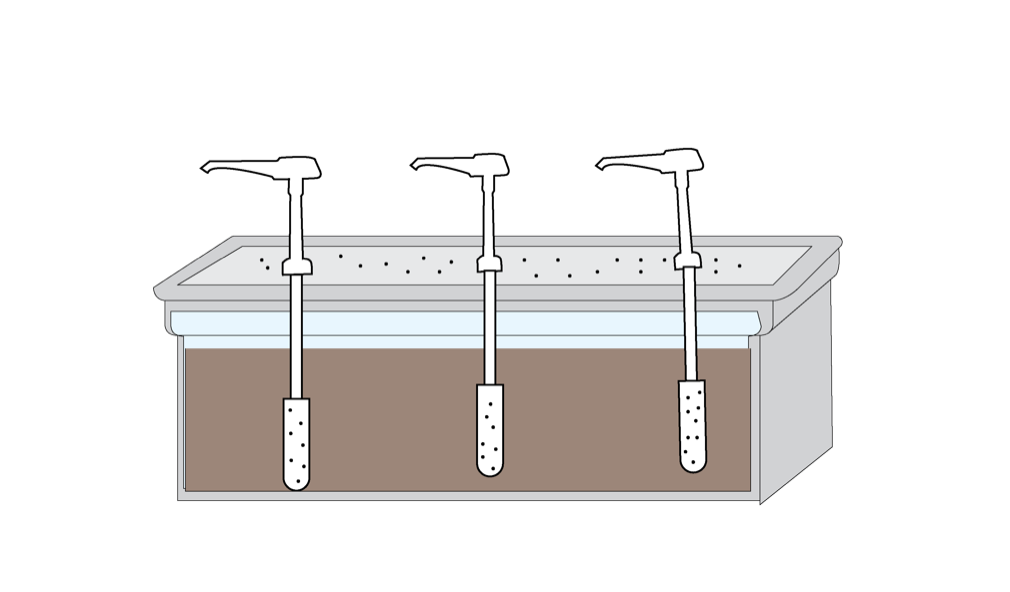
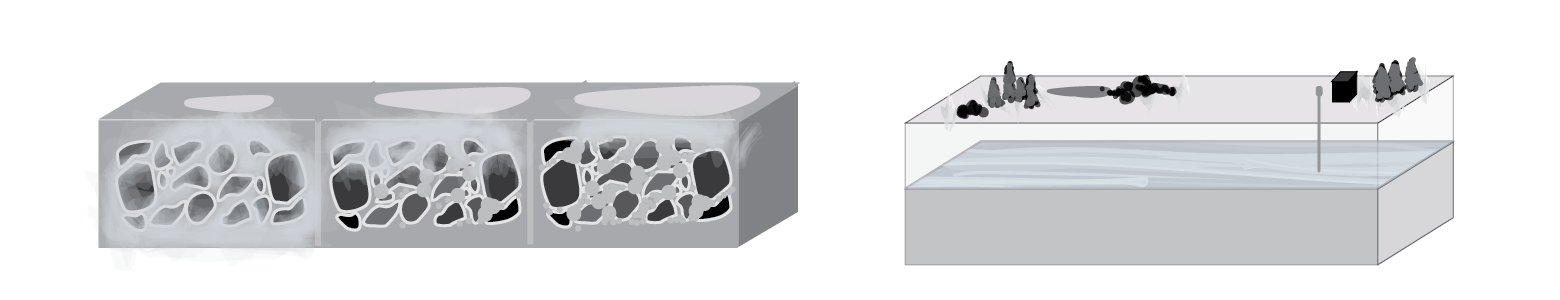
A good groundwater system should accomplish a few things: It should integrate porous sediment (sand), be rechargeable with water from above (to model precipitation), and incorporate one or more wells and/or pumps (to simulate human extraction of water from aquifers). You can purchase Groundwater Model Kits from various online providers ($200-$900 per model), however building your own using a plastic shoebox and condiment/shampoo pumps is reasonably straightforward and significantly less expensive ($70 for a set of 10 that works with 30 students). These models work year after year, so they are worth the up-front time investment of building them yourself.
Download the guides below, pioneered and perfected by veteran California earth science educator Ryan Hollister:
- Materials and Tools For Your Groundwater Model
- Step-by-step Guide To Building A Groundwater Model
- Acid Mine Drainage Simulant Recipe
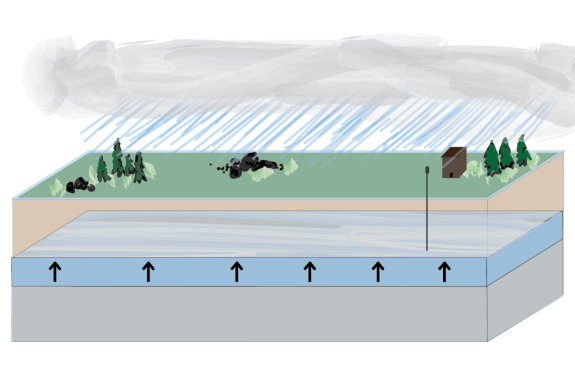
Each finished groundwater model should work and function like this:
The Groundwater Model Simulation: A Shared Aquifer
In this modeling exercise participants will experience the use dynamics of a shared aquifer system. Because this activity models a shared aquifer system, students will work in groups of three, each “living” on a simulated plot of land with its own “well” (pump). Students will pump water out of their wells to simulate withdrawal needs for the water users in a given month.
Groundwater Model Setup
- Split students into groups of three “well owners,” and provide each group with a groundwater model setup and three beakers with at least a 100ml capacity.
- Fill each groundwater model with water until the water sits 1 – 2 cm above the surface of the sand.
- Assign the students in each group to one of the three plots of land (each student should have their own pump).
- Make up a recipe of acid mine drainage simulant for each student group using this acid mine drainage simulant recipe.
- Have each group download a copy of the digital Well Monitoring Data Spreadsheet to track their pumping and contamination data throughout the simulation. Note: The virtual spreadsheet has cell calculations pre-populated to account for rainfall variability and generate rainfall and water pumping totals after each simulated month.
- Provide a pH probe to each group OR set of 30 (3 x 10) pH indicator strips to test the pH of each well for 10 pumping simulation rounds.
- Provide copies of the Printable Groundwater Simulation Instructions to walk students through each ”month” of the simulation, described below.
Month 1: Typical Monthly Use
In this simulation, each month of use is represented by 60 seconds of active pumping. To maintain their quality of life, each well owner must pump between 90 and 100 ml of water from each well in a 60-second month. Once the month is over, no more pumping is allowed until the next month’s rainfall.
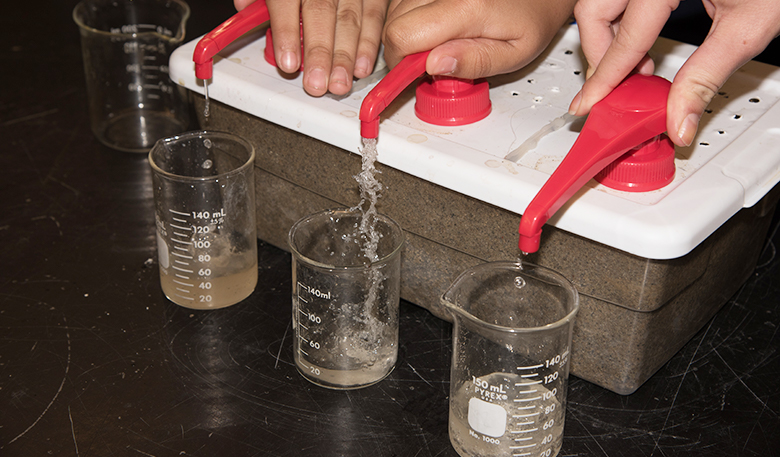
- All well owners: At the start of the timer (60 seconds), begin pumping steadily (not fanatically!) Stop as soon as your 60 seconds are up.
- Measure and record the volume of groundwater pumped in “Month 1” of the “mL Pumped” column in the Well Monitoring Data Spreadsheet.
- Use pH paper or pH probe to test the pH of each well’s water and record the data in “Month 1” of the “pH” data table. This will be your baseline pH for the system.
- Dump the pumped water down the sink after pH has been recorded.
You’ll notice that when you add your pump volumes to the Well Monitoring Data Spreadsheet, it will automatically calculate the “Amount of Surface Water for Recharge” that will be contributed to the system’s aquifer the following month. Recharge of aquifers happen when water from the surface of the earth infiltrates the pore spaces of the soil, sediments or rocks. Since monthly rainfall amounts in the simulation region are highly variable, the amount of recharge calculated each month will reflect that variability. The amount of surface water for recharge will also reflect the pumped volumes from the previous month to account for variability in the pumping efficiency of each pump and well owner.
Month 2: Recharge And Acid Mine Drainage Contamination Event
Owners of Well #2 and #3:
- Use tap water to fill graduated cylinders with the amount of water needed for recharge calculated by the spreadsheet.
- Slowly pour out the water to “make it rain” over each well’s parcel of land. The water should drain through the box-top’s holes.
Owner of Well #1
- Oh no! Acid mine drainage has contaminated the land and surface water is infiltrating and recharging the aquifer under Well #1. Using the acid mine drainage simulant (citric acid), measure and fill graduated cylinder with calculated amount of water needed to recharge the land of Well #1 found in your spreadsheet, being careful not to cross-contaminate
- Slowly pour out the acid mine drainage water to “make it rain” over the parcel of land.
All Well Owners:
Make predictions about how the acid mine drainage will affect the shared aquifer system. Be sure to address the following questions in your prediction, citing evidence from the simulation, the video, your research, and the evidence below to support your claim.
- What effects might the acid mine drainage have on the aquifer system, and the owners of each of the three wells over a period of four months?
- Which parcel(s) of land will be affected the most?
- How do you think the effects of the acid mine drainage will change over the course of four pumping and recharge cycles?
Some evidence to consider while making your reasoned predictions:
- The National Secondary Drinking Water Regulations (NSDWRs) considers safe drinking water to have a pH of 6.5-8.5.
- Many plants cannot survive in soils that are too acidic.
- Sand is a very porous and permeable sediment.
Month 2: Pumping
- Communities and farms that use wells #1, #2 and #3 require 90 – 100 ml of safe water each month (60 seconds) to maintain their way of life. Start a timer and pump water for 60 seconds.
- Record the amount of water pumped from each well in Month 2 in the data table.
- Measure and record the pumped water’s pH level in Month 2 in the data table.
- Dump the pumped water down the sink after the pH has been recorded.
Months 3-10: Hooray! The Cause Of The Acid Mine Drainage Was Stopped At Its Source!
The source of the acid mine drainage was contained, so recharge water is no longer acidic!
- Use tap water to fill graduated cylinders with the calculated amount of surface water for recharging the aquifer.
- Slowly pour water over the assigned parcels of land. Wait 45 seconds.
- Start a timer for 60 seconds to begin the next “month” and pump water from wells #1, #2 and #3.
- Record the amount of water pumped from each well in the appropriate month row of the data table.
- Measure and record the pumped water’s pH level in the appropriate month row of the data table.
- Dump the pumped water down the sink after the pH has been recorded.
- Repeat steps 1 – 6 until you’ve completed 10 simulation months of recharge-pumping cycles.
Data Analysis
Create a line-graph depicting the pH levels of all three wells over time.
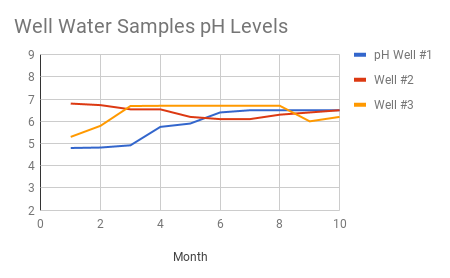
To create the graph:
- Place “pH” on the vertical axis, data range from 2 to 9.
- “Months” should be on the horizontal axis and range from 0 to 10
- Use a different color to depict each well, and provide a key (Example: Well 1 = red, Well 2 = blue, Well 3 = Green).
Simulation Inferences:
- What trends or patterns did you notice in the pH data and resulting graph?
- How did acidity change over time at each well?
- Why did the acidity of the well water change over time?
- How might the porosity and permeability of the sediments contribute to observed patterns?
- What questions do you have as a result of looking at the data and graph?
Visualizing The Plume Through Time
With enough data points, a plume of contaminated groundwater can be monitored over time to determine the size of the region it affects and to predict directions it may flow in the future. In this simulation, there are only three data points for each month so a detailed map of the plume and its movement isn’t possible. However, we can visualize how the acidity across the three-pump aquifer system changes over time.
Look at the “Pollution Plume Data Visualization” worksheet. The small diagrams represent a birds-eye view of the shared aquifer model.
- For each month, write the corresponding pH levels at each well in small writing. (Wells are represented by circles in the diagram.)
- Using the color scale appropriate for the pH you are using, draw a small swatch of color that represents the pH on top of the numbers you wrote in the previous step.
- Your final data visualization should be a solid gradient of colors that changes based on the observed pH in well water. To fill-in the blank areas between the color swatches you’ll need to make assumptions about the pH in the water between wells that you didn’t directly measure. For this model you can assume that the distance halfway between the wells will be the average of the pH in the two wells. For example, if Well #1 has a pH of 4.8 and Well # 2 has a pH of 6.8, we will assume that the pH of the water between the wells will change at equal intervals from 4.8 (dark orange) to 5.0 (yellow) to 6.0 (light green) to 6.8 (darker green very similar to 7.0). The “halfway” point between pH 4.8 and pH 6.8 can be assumed to be the average of Well #1 and Well #2 which would be 5.8.
(4.8+6.8)/2 = 5.8. - Use the visualizations to answer the questions on the Pollution Plume Data Visualization Worksheet.
Final Questions
In this simulation, the acid mine drainage came from a long-abandoned mine that has been in disrepair for over 100 years, a scenario that is fairly typical of acid mine pollution events.
- Who was affected by the AMD in your aquifer system model? How does your simulation compare to the actual effects detailed in the story? Cite specific data from your studies to support your argument.
- In your group’s opinion, who should be responsible for making sure the groundwater in the aquifer is suitable for human consumption? Be sure to support your claim with a well-reasoned explanation.
- With your group, list and describe at least two ideas that could be used to remediate the contamination in real life. That is, what could be done to clean up the acid mine drainage or protect the aquifer so that the groundwater being pumped is safe for human consumption? Consider searching for examples of successful acid mine remediation.
- Optional: Plan a remediation simulation for the model using your recommendations from #3, and then implement your remediation plan with your groundwater model.
Next Generation Science Standards
HS-ESS2-2. Analyze geoscience data to make the claim that one change to Earth’s surface can create feedbacks that cause changes to other Earth systems.
HS-ESS3-4. Evaluate or refine a technological solution that reduces impacts of human activities on natural systems.
Credits:
Groundwater model, simulation, and student materials by Ryan Hollister
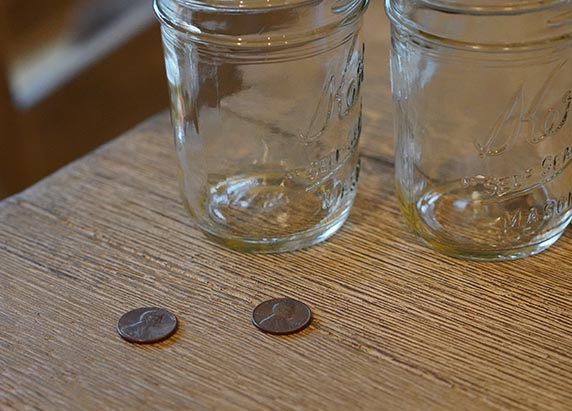
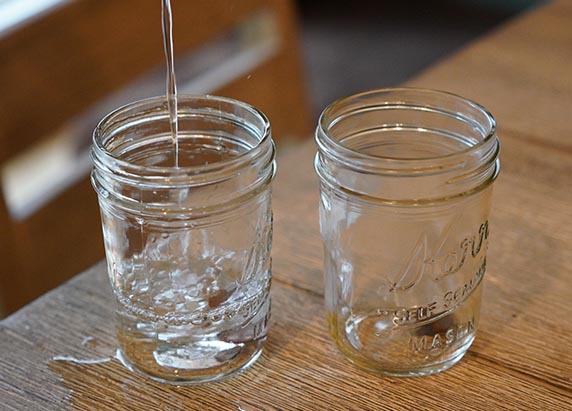
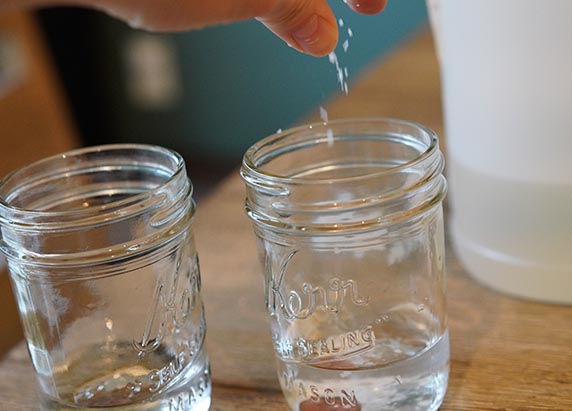
Resource and penny demo written by Ariel Zych
Production: Xochitl Garcia, Ariel Zych
Editing and revisions: Ariel Zych, Brian Soash, Ryan Hollister
Educator's Toolbox
Meet the Writers
About Ariel Zych
@arieloquentAriel Zych was Science Friday’s director of audience. She is a former teacher and scientist who spends her free time making food, watching arthropods, and being outside.
About Ryan Hollister
@phaneriticRyan J. Hollister is a veteran geoscience and AP environmental science teacher at Turlock High School in Turlock, California. Through a signature blend of enthusiasm and expertise, he fosters an appreciation in his students for the physical processes that have shaped the region they call home: California’s Great Central Valley. Ryan’s ultimate goal is to help shape a citizenry that will solve the air and water quality problems that plague the San Joaquin Valley.
About Xochitl Garcia
@msxgarciaXochitl Garcia was Science Friday’s K-12 education program manager. She is a former teacher who spends her time cooking, playing board games, and designing science investigations from odds and ends she’s stockpiled in the office (and in various drawers at home).